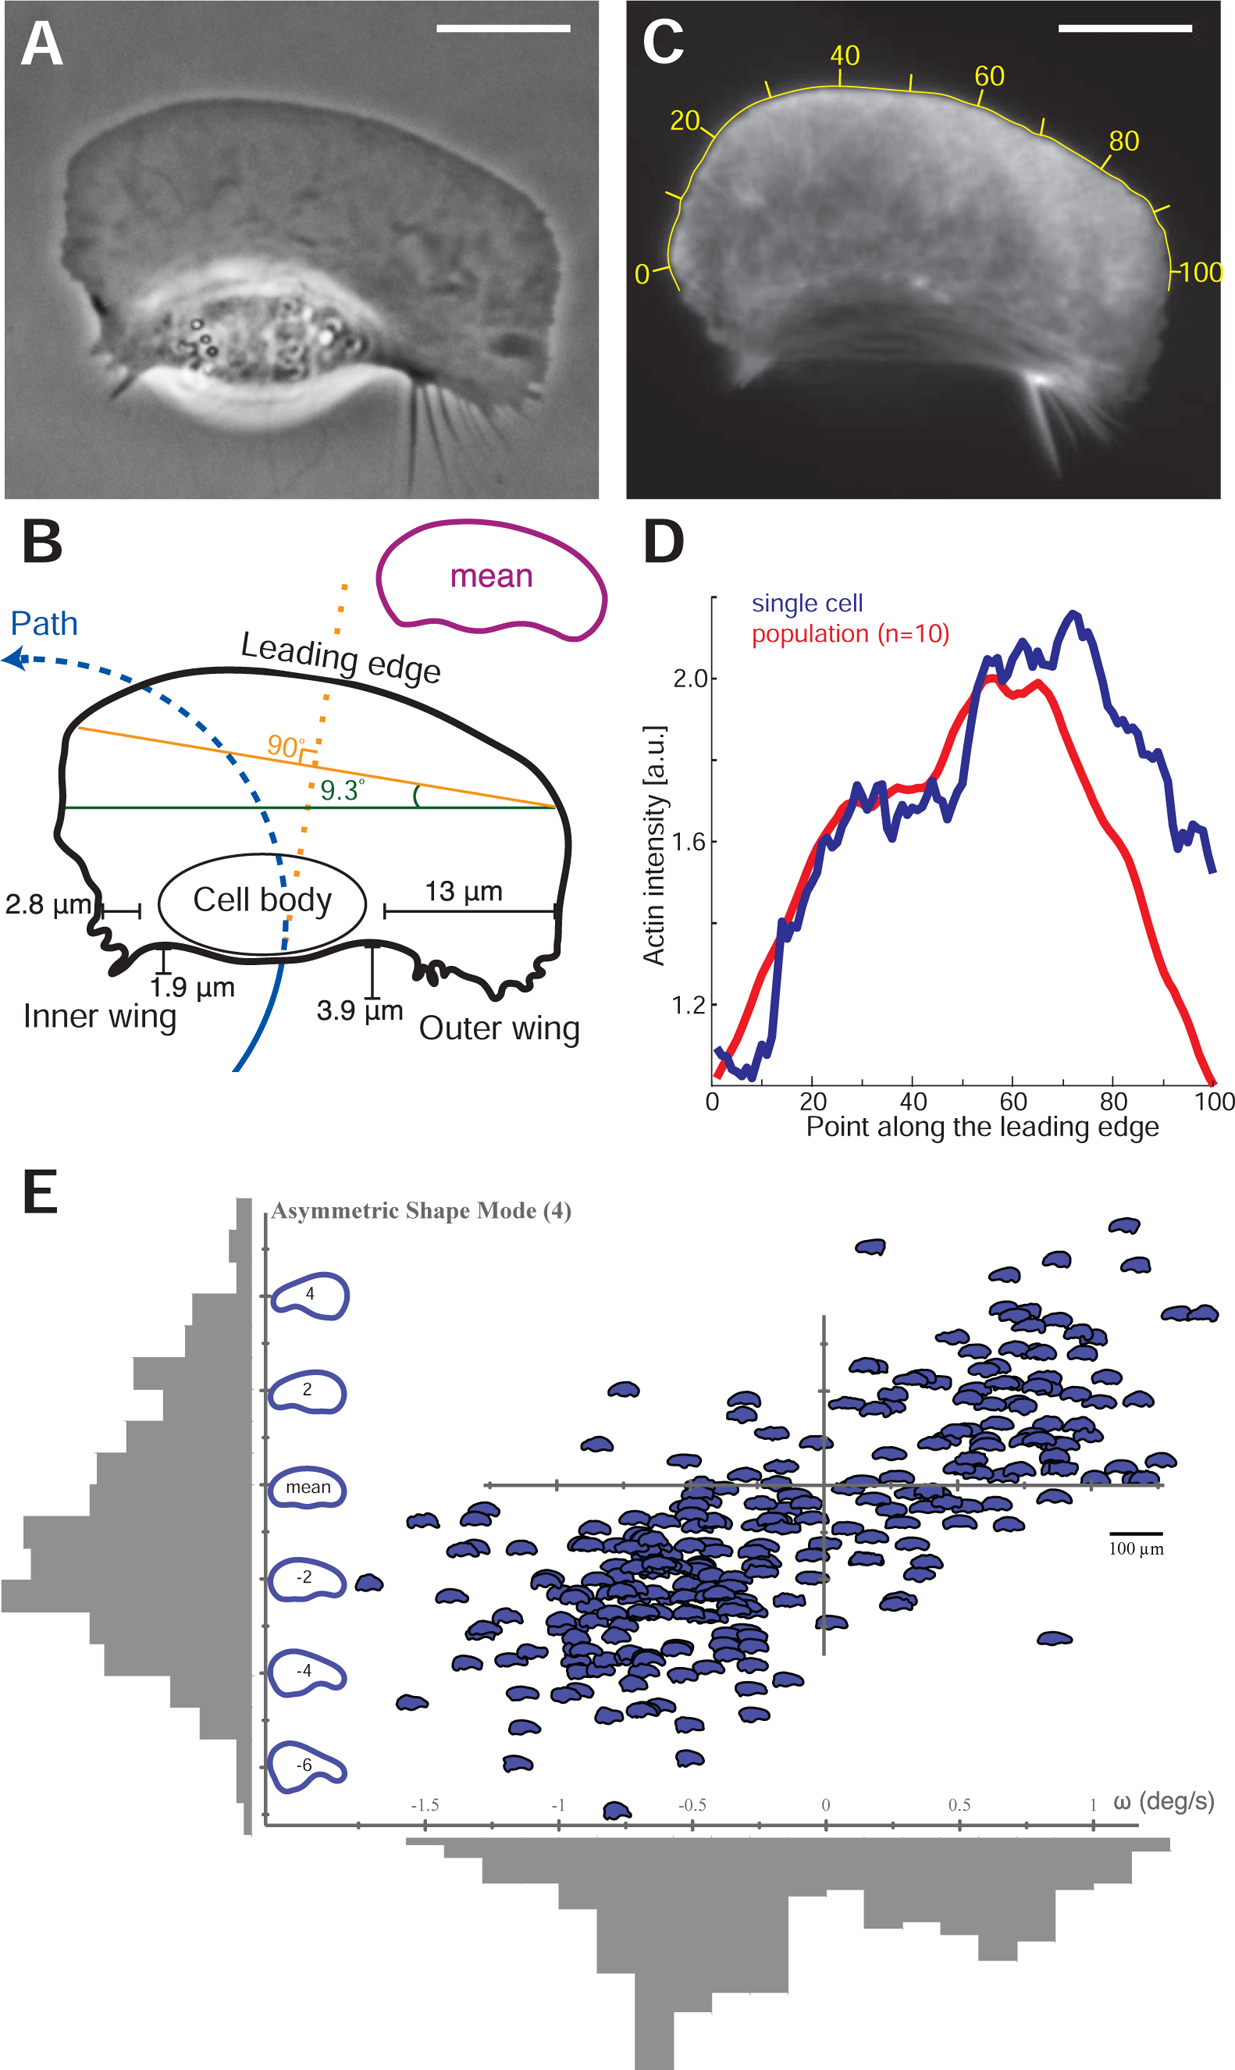
Figure 2. Turning cells have asymmetric shapes and F-actin distributions.

(A) Example phase-contrast image of a cell in an asymmetric circular path turning counter-clockwise. Scale bars in all panels are 10 μm.
(B) The contour of this cell illustrating the cell path (blue line) as well as the elongated aspect ratio on the outer side of the turning cell. The cell body is displaced towards the inside of the turn, and the outer wing lags behind the cell. The leading edge orientation (orange line) is orthogonal to the direction that the cell was previously traveling previously (dashed orange line) and the rear edge orientation (green line) is orthogonal to the direction the cell is currently traveling. The inset contour shows the average shape of 22 mutually aligned turning cells.
(C) F-actin distribution from this turning cell as visualized by AF-488 phalloidin labeling, with yellow numbers indicating position along the leading edge.
(D) Measured density of F-actin along the points of the leading edge of the cell in panel C (blue line) and in the average of a population of 10 turning cells (red line). Note the asymmetric accumulation of actin filaments at the leading edge on the outer side.
(E) For a single cell that is being forced to turn at a high rate by exposure to multiple external electric fields over 272 time points over approximately 20 minutes, the angular velocity at each time point, ω, is plotted against the left-right asymmetric PCA shape mode (Keren et al., 2008) as depicted on the vertical axis. The distribution of values for both asymmetric shape and angular velocity are plotted in grey adjacent to each axis. Calculated correlation coefficient is 0.73, calibration bar for cell outline images is 100 μm.
