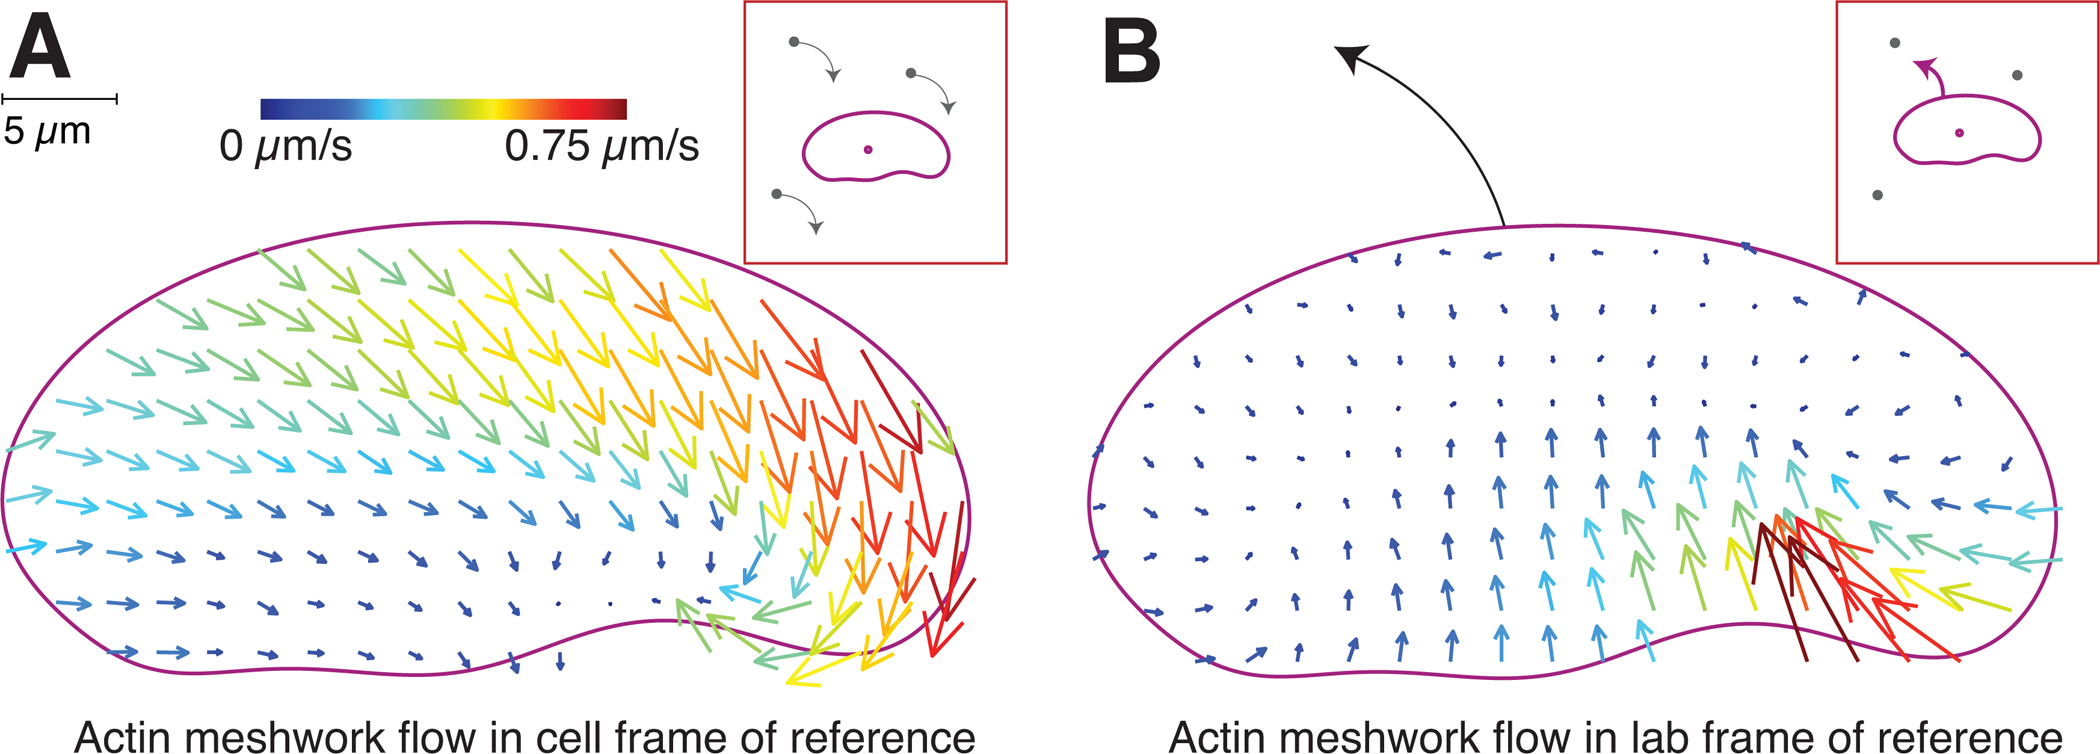
Figure 4. Asymmetric centripetal actin network flow in turning cells produces an asymmetric myosin distribution.

Experimentally determined vector maps representing fluorescence speckle microscopy measurements of the flow of the F-actin network in the cell frame of reference (A) and in the lab or substrate frame of reference (B) for a cell turning counter-clockwise. Results are representative of measurements made in 12 separate cells. Graphical depictions of each frame of reference are presented in insets. Scale bar indicates 5 μm, and vector arrow size and color scales with magnitude of flow speed.
