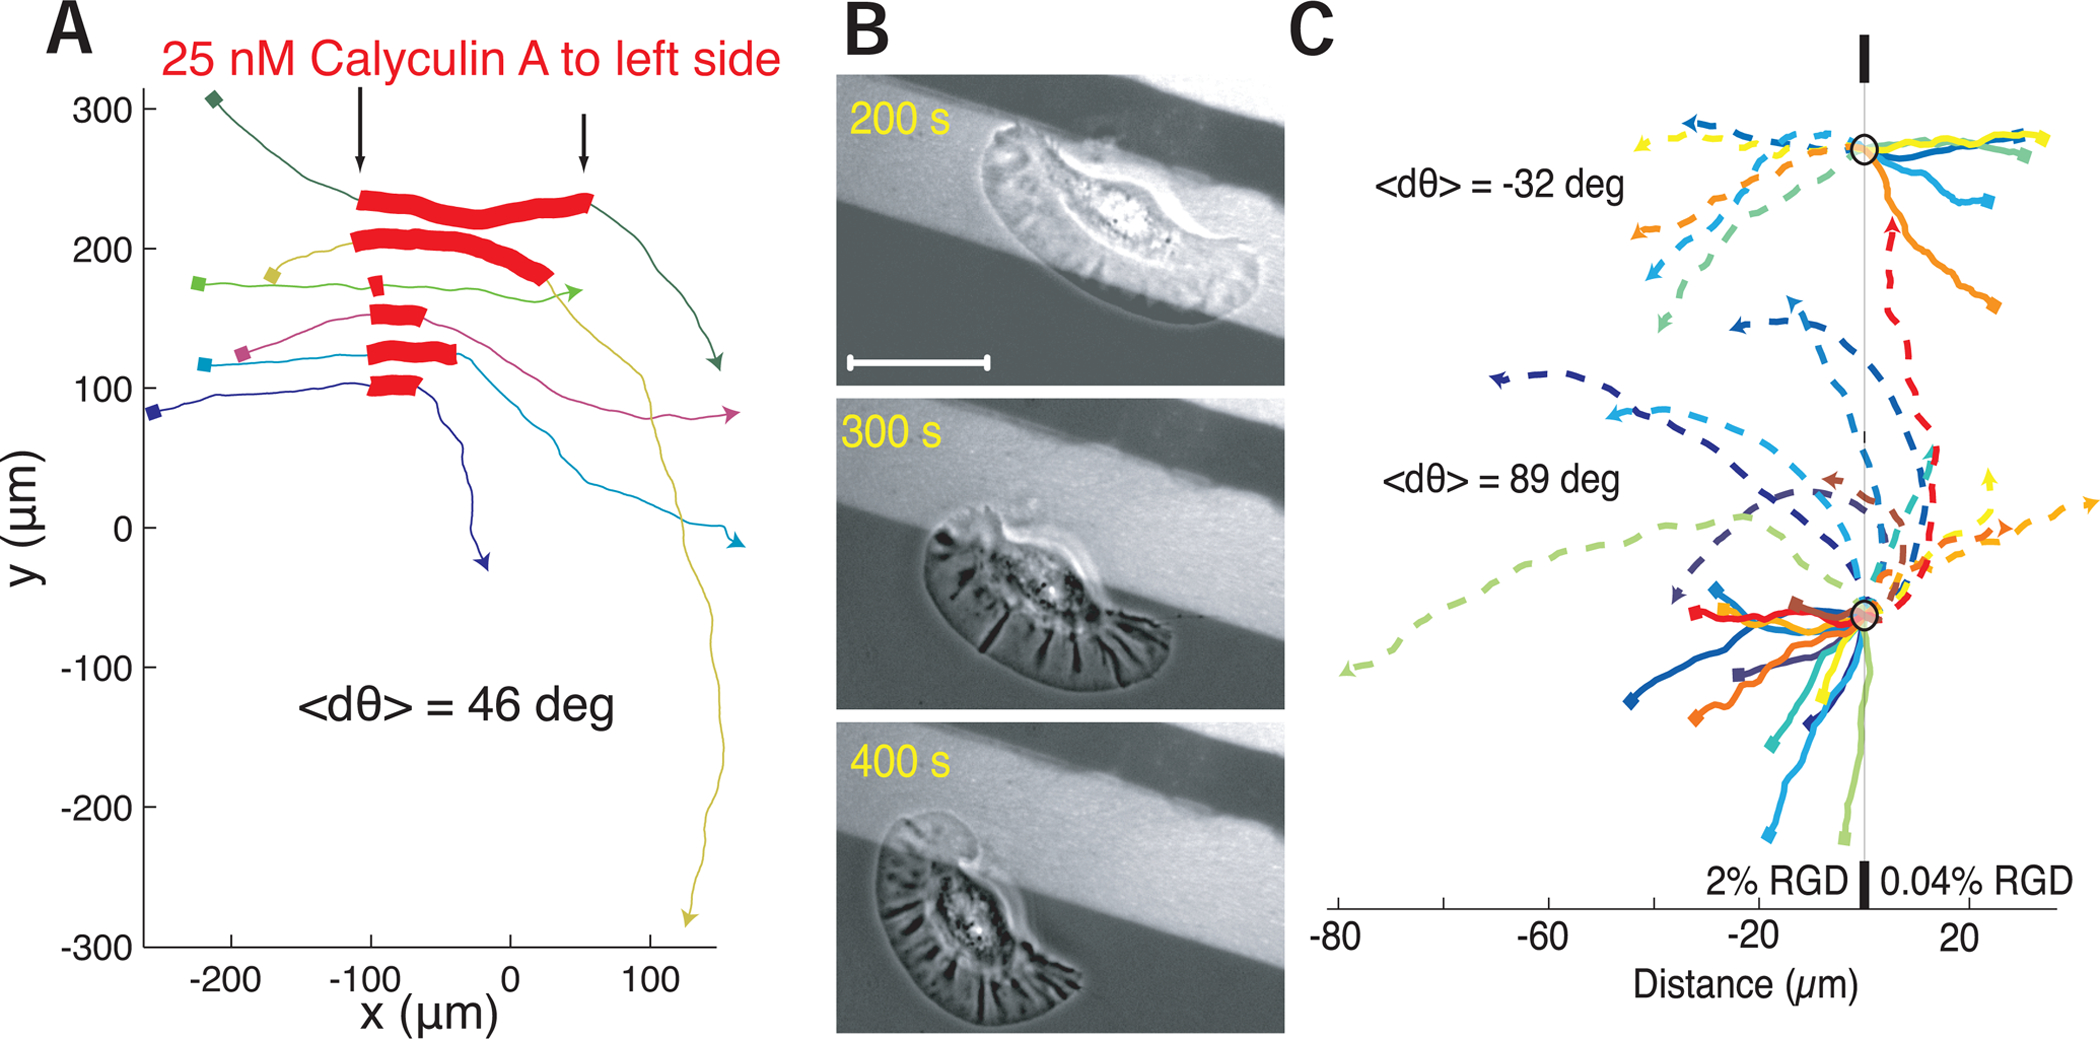
Figure 6. Myosin or adhesion asymmetry is sufficient to induce turning.

(A) The trajectories of a set of cells that were asymmetrically exposed to calyculin locally on the left side of the cell during the portion of the trajectory marked in red. Local calyculin exposure induced cells to turn away from the side of upregulated myosin II activity. Trajectories start at squares and proceed from left to right. Each color indicates a different cell.
(B) Images of a single cell crossing a boundary between a 2% RGD normal adhesion substrate (light) on to a 0.04% RGD low adhesion substrate (dark), causing the cell to turn toward the high adhesion side of the cell when adhesion at the rear becomes unbalanced. Scale bar indicates 10 μm.
(C) Trajectories of a set of cells crossing a boundary of normal adhesion density (2% RGD) to low adhesion density (0.04% RGD) on the bottom and from low adhesion density to normal adhesion density on the top. Start positions are marked with small squares, dashed lines indicate trajectories after hitting boundary. All trajectories are centered on the boundary collision point marked with circle. Cells either reflect off the adhesion boundary or refract towards the side of higher adhesion, where the change in direction is dependent on the incident angle with the boundary. Scale bar on bottom indicates distance in microns.
