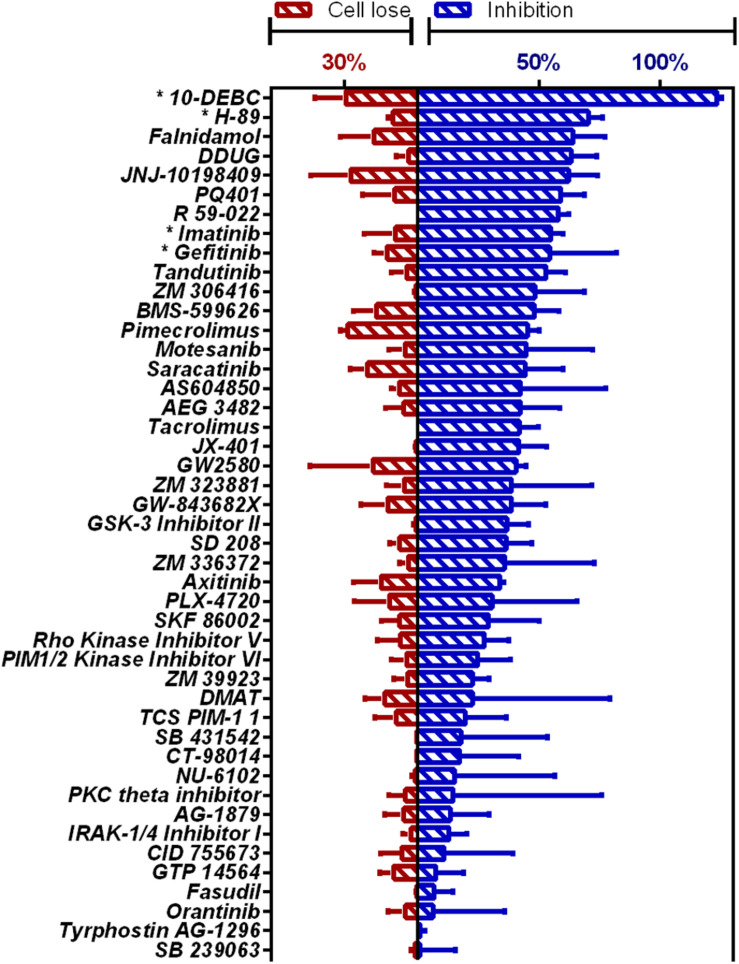
FIGURE 1.
HCS of OICR Kinase Inhibitor library against intracellular M.tb. Inhibition of M.tb growth (blue), interpolated to the negative control (1% DMSO) set at 0% inhibition and the positive control (4 μM bedaquiline) defined as 100% inhibition. Cell loss (red), normalized to negative control. Previously identified host-targeting M.tb inhibitors marked with asterisk (*). Means from compounds with negative z-score and cell loss <30% (n = 45) are graphed. Error bars represent the SD from two independent screens. Full list of compounds and z-scores are tabled in Supplementary Table 2.

