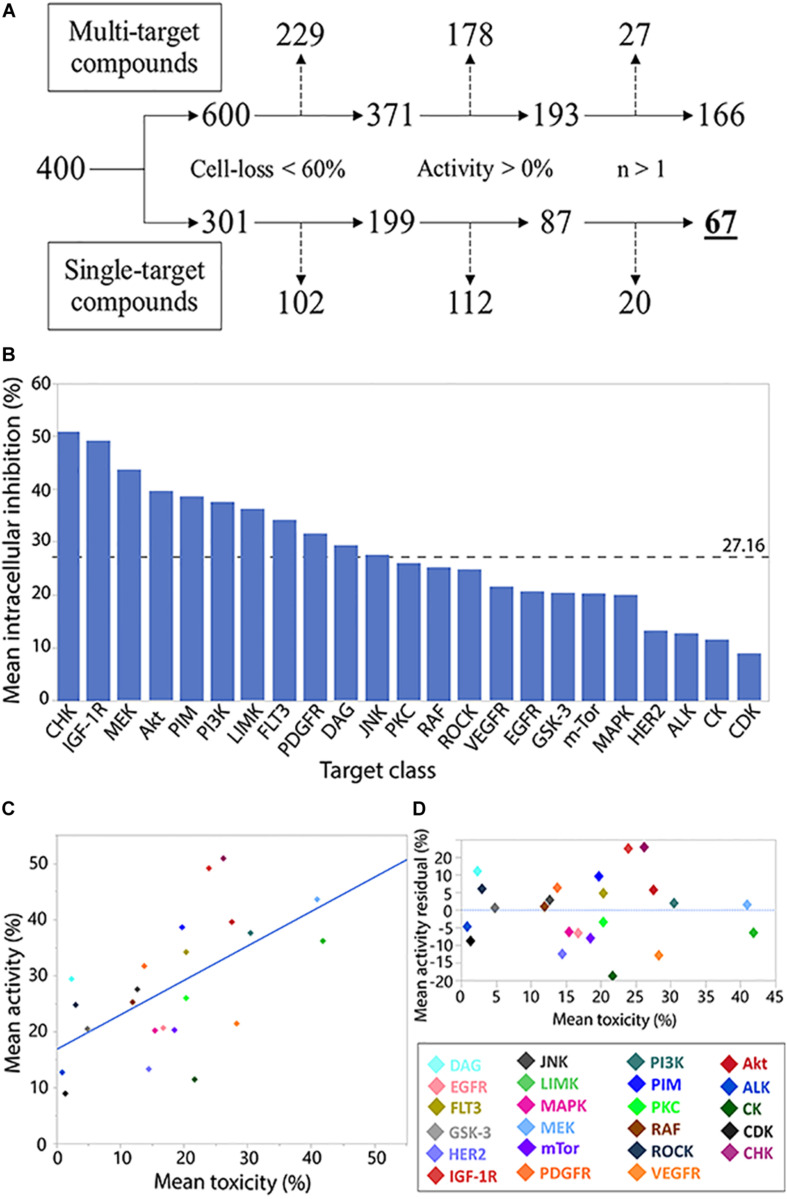
FIGURE 2.
Analysis of compound target class/family. Flowchart analysis of the logic steps taken to ensure activity characterization (measuring normalized intracellular bacterial growth inhibition) of target families was gathered from non-pleiotropic compounds (single-target compounds) and were not skewed by THP-1 cell-loss, exhibit anti-M.tb activity, and were represented by more than 1 compound in the library. Branch shifts from compound numbers (400) to compound target numbers (600/301). Excluded targets from each step marked by dashed arrows (A). Compound family charted by mean inhibitory activity. Weighted average marked by dashed line (B). Regression analysis of family toxicity (cell-loss) on activity resulted in linear regression with RMSE = 9.66% (R2 = 0.36) (C). Analysis of residual activity by target family classes. Positive or negative residual values represent higher or lower activity, respectively, than can be explained by toxicity effects against THP-1 cells (D).

