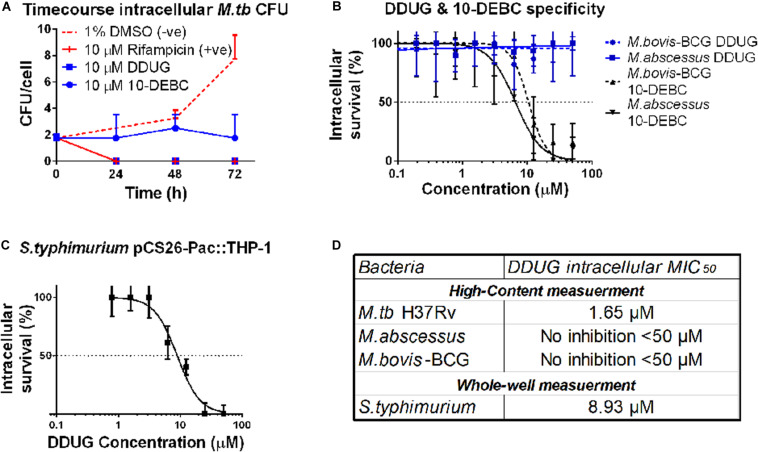
FIGURE 4.
DDUG Mode of intracellular inhibition and Mycobacteria specificity. Intracellular CFU calculated by normalizing to number of THP-1 cells, treated with DDUG (blue squares) or 10-DEBC (blue circles) or controls (red) (A). Compound specificity was compared by challenging pathogenic mycobacteria (M. abscessus, solid line; M. bovis-BCG, dotted line) with DDUG (blue) or 10-DEBC (black) in an intracellular dose-dependency assay, normalized to 1% DMSO (0% inhibition) and 4 μ M bedaquiline (100% inhibition) (B). DDUG inhibition of luciferase-expressing S. typhimurium growth in infected THP-1 cells (C). Error bars represent the SEM from four (A,B) or six (C) independent trials. Comparison of DDUG intracellular effect on different bacteria (D).

