FIGURE 1.
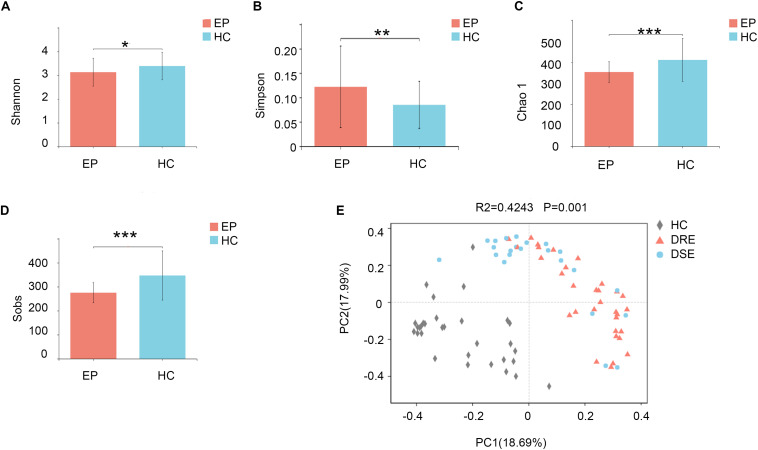
Comparison of fecal microbiota structure between patients with epilepsy and HCs. The (A) Shannon (p = 0.02*) and (B) Simpson (p = 0.009**) indexes were used to detect higher community diversity in terms of both richness and evenness in the patient group. The (C) Chao1 index (p = 0.0003***) revealed greater community richness. (D) The observed species (p = 0.0001***) were used to characterize good sequencing depths. The alpha diversity indexes revealed significantly decreased ecological diversity in the fecal microbiome in patients with epilepsy (n = 55) compared with individuals without epilepsy (n = 46). (E) PCoA plots based on the relative abundances of microbiota indicated that the microbiome samples were clustered by group (DRE, DSE, and HC) (PC1 = 18.69%, PC2 = 17.99%). Notes: *p < 0.05, 0.001 < p < 0.01**, p < 0.001***; EP, patients with epilepsy; HC, healthy spouse-matched controls; DRE, drug-resistant epilepsy; DSE, drug-sensitive epilepsy.

