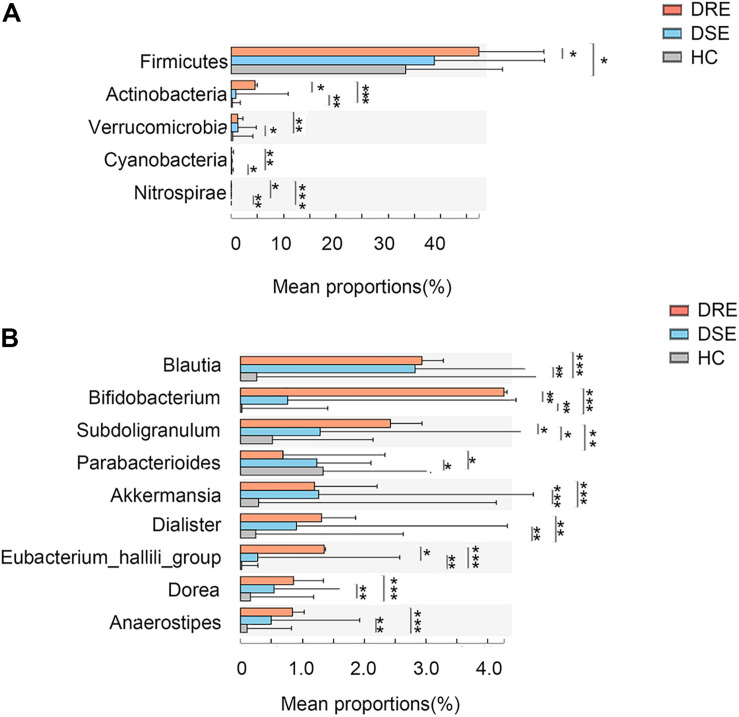
FIGURE 4.
Microbiome alterations in patients with different clinical prognosis outcomes and HCs. The relative abundances of 5 taxa at the phylum (A) and 8 taxa at the genus (B) level were significantly different among three groups. (DRE: 30, red; DSE: 25, blue) and HCs (n = 46) after correcting for confounding variables. DRE, drug-resistant epilepsy; DSE, drug-sensitive epilepsy; HC, healthy spouse-matched controls. *p < 0.05, 0.001 < p < 0.01**, p < 0.001***.

