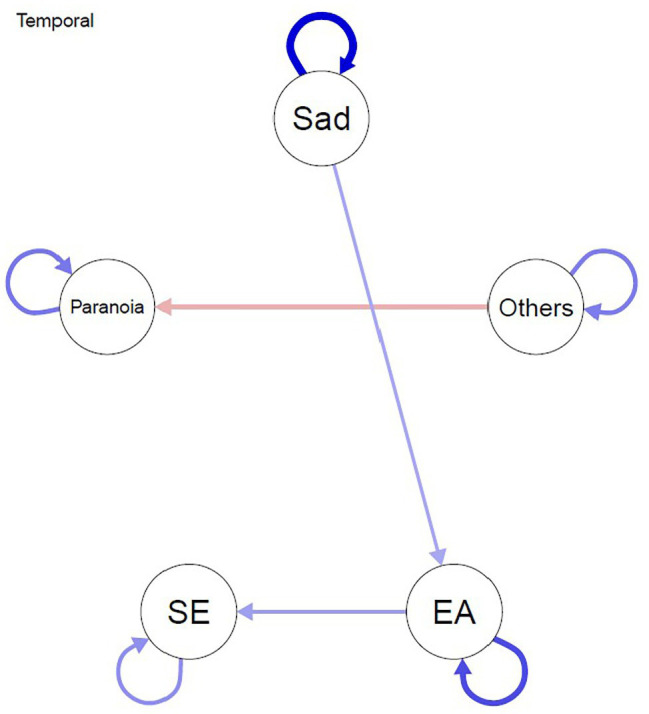
Figure 2.

Temporal network model. Edges represent prediction between nodes from one measurement point to the next measurement point that remain after controlling for all other variables at the previous measurement point. Blue lines depict positive associations and red lines depict negative associations between ESM variables. SE, self-esteem; EA, experiential avoidance; Others = closeness to others.
