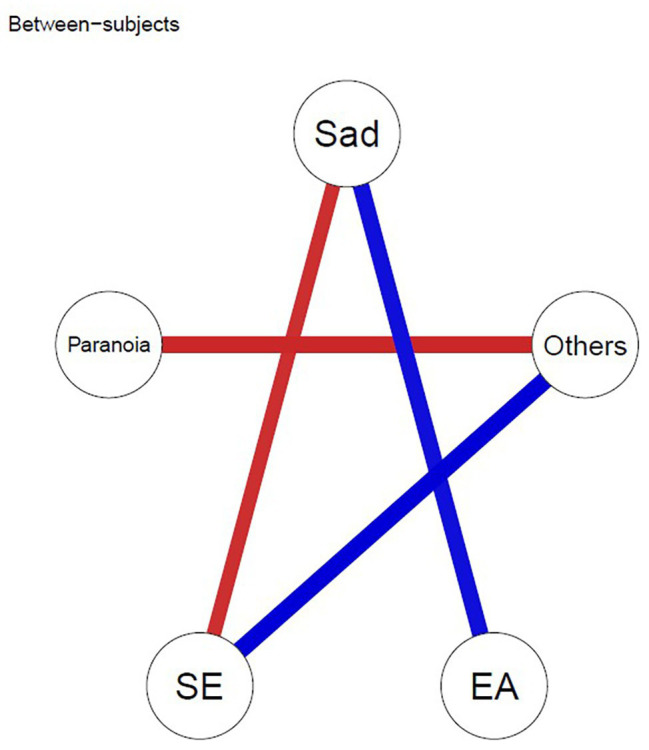
Figure 3.

Between-subject network model. Edges represent correlations between intra-individual mean levels, after taking into account the remaining variables in the network. Blue lines depict positive associations, and red lines depict negative associations between ESM variables. SE, self-esteem; EA, experiential avoidance; Others = closeness to others.
