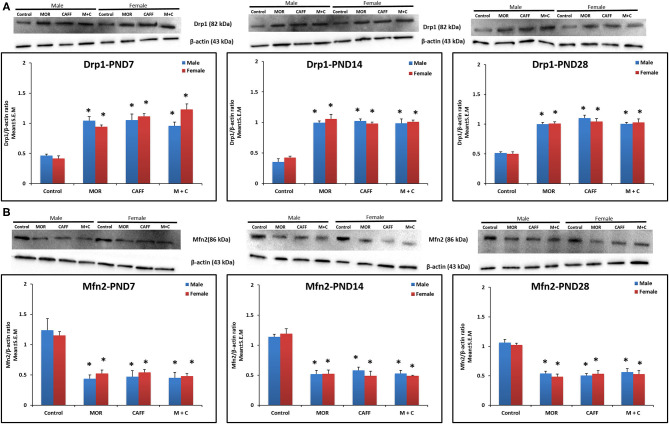
Figure 3.
Expression of mitochondrial fission protein Drp1 (A) and mitochondrial fusion protein Mfn2 (B) in rat pup's brain. Western blots and densitometry graphs of Control, MOR, CAFF, and M+C treated pups brain tissues at PND 7, PND 14, and PND 28. All blots are representative of four different experiments with similar results. β-Actin was used as a loading control. Values are expressed as mean ± S.E.M. *P < 0.01 vs. Control.

