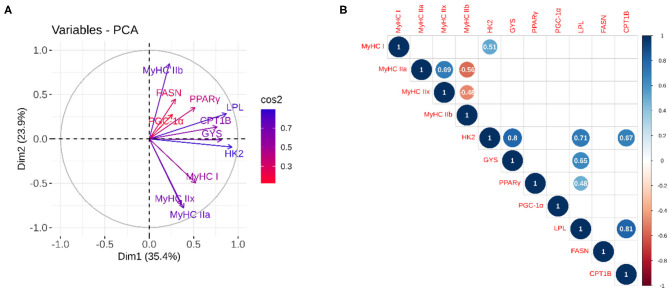
Figure 3.
Principal component and correlation analysis between the relative expression of genes related to contractile (MyHC isoforms) and metabolic phenotypes (energy metabolism-related genes). (A) The quality of representation was measured using the squared cosine (cos2), and the variables that contribute most to the separation of the trait between dimensions 1 and 2 are in blue; (B) The correlation analysis between variables. The size and color of the circle denote the strength of the relationship and its direction. Only the significant correlations are represented, and the values of the correlation are given inside the circles.

