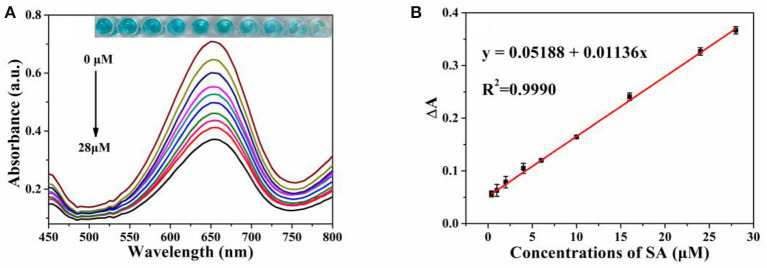
Figure 6.
(A) The vis absorption spectra of MIL-53(Fe)-TMB-H2O2 upon concentrations of SA (from 0 to 28 μmol L−1). Inset: the corresponding photograph of the colored products; (B) The linear relationship between absorbance intensity (ΔA) and SA level. Error bars represent the standard deviation of three trials.

