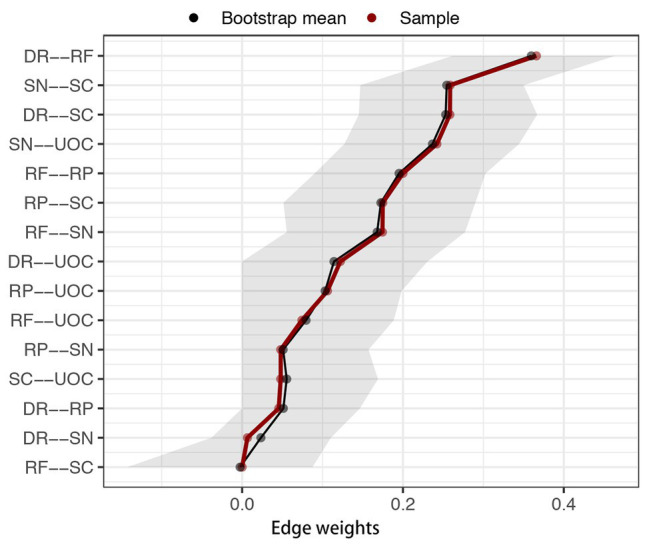
Figure 3.

Bootstrapped 95% confidence intervals (CI) of edge weights. DR, applying decision rules; RF, resistance to framing; RP, consistency in risk perception; SN, recognizing social norms; SC, resistance to sunk costs; UOC, under/overconfidence. The red line indicates the sample edge weight (sorted in increasing order in x-axis) and the gray bar is the bootstrapped CI.
