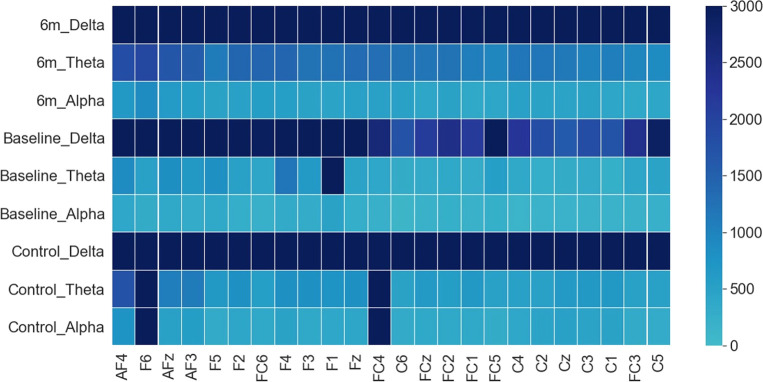
Figure 5.
Grand average of AverageDifference across Delta, Theta and Alpha frequency bands in HC (bottom three rows), FEP baseline (middle three rows), and FEP follow-up (top three rows). X axis: electrode sites; Y axis (far right): the absolute value of the average AverageDifference. In all groups, the delta frequency showed the strongest signal across all 24 channels.

