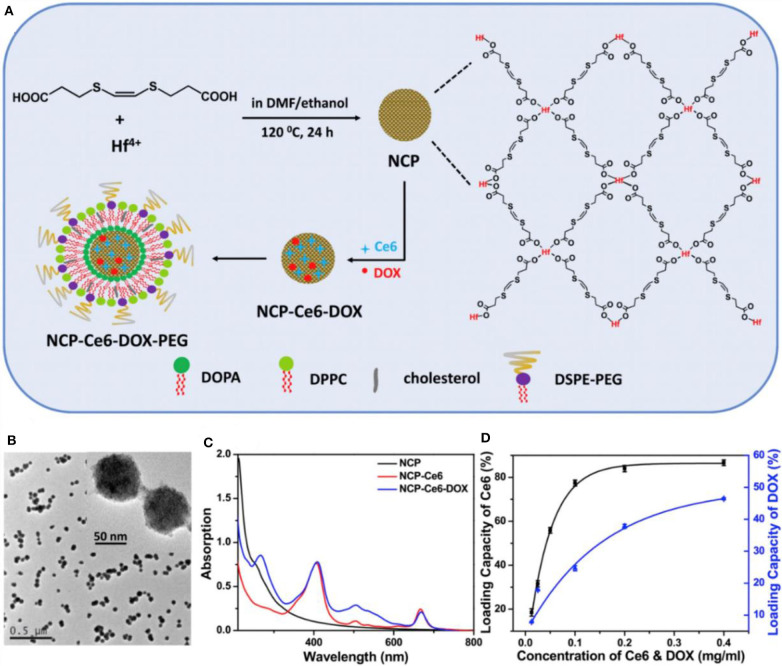
Figure 6.
The synthesis and characterization of NCP-Ce6-DOX-PEG nanoparticles (Liu et al., 2017a) (Copyright 2017a, reproduced with permission from Elsevier). (A) The schematic illustration for the synthesis of NCP-Ce6-DOX-PEG nanoparticles. (B) A TEM image of NCP nanoparticles. The insert is an image with higher resolution. (C) UV-vis-NIR spectra of NCP, NCP-Ce6, and NCP-Ce6-DOX. (D) Quantification of Ce6 and DOX loadings at different feeding concentrations of Ce6 and DOX in ethanol. NCP solutions with the same concentration (0.05 mg/mL) were used in this experiment.

