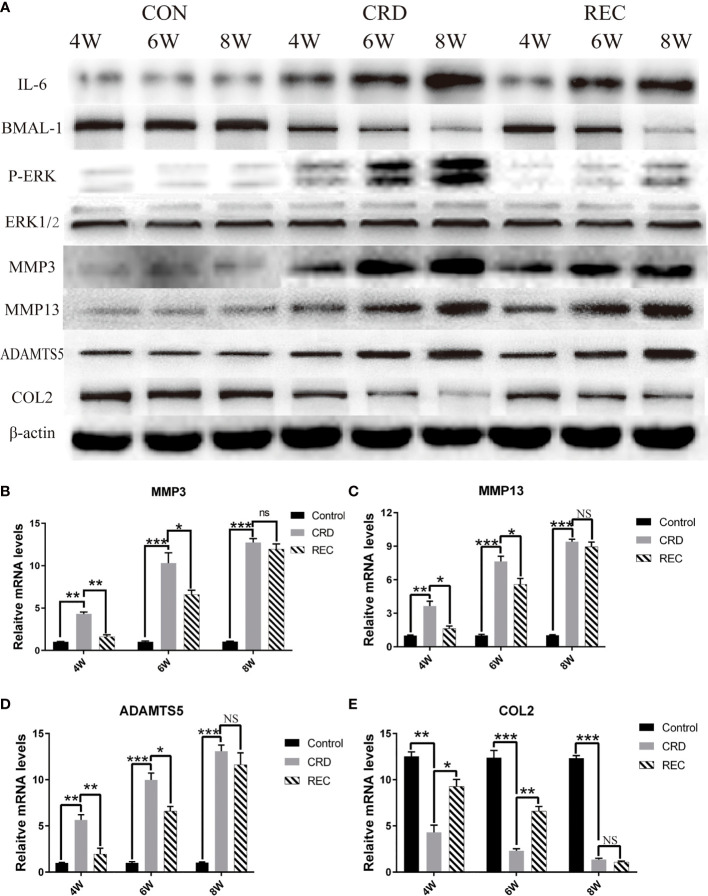
Figure 3.
Expression trends for IL-6/P-ERK/BMAL-1/MMP3/MMP13/ADAMTS5/COL2 in the CON, CRD, and REC groups. (A) Western blot results for IL-6/P-ERK/BMAL-1/MMP3/MMP13/ADAMTS5/COL2. (B–E) RT-qPCR analysis of MMP3/MMP13/ADAMTS5/COL2. All experiments were performed in triplicate, and the results are expressed as the mean ± SD. *P < 0.05; **P < 0.01, ***P < 0.005. NS, not significant.

