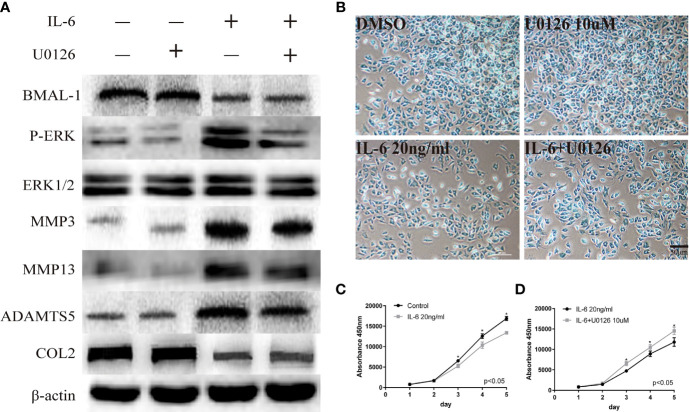
Figure 4.
Regulatory relationship between BMAL-1/P-ERK and IL-6. (A) Western blot assays demonstrate the relationship between BMAL-1, P-ERK, MMP3, MMP9, MMP13, and COL2, while the expression levels of ERK1/2 and β-actin were the same in the cartilage tissues of the control group, CRD group and REC group. (B) Alcian blue staining results for MCCs stimulated with 20 nM or 10 µM U0126 and 20 ng/ml IL-6 for 12 h. (C, D) A CCK-8 assay was used to examine the cell proliferation of each group and the effects of u0126; the absorbance was measured at 450 nm. All experiments were performed in triplicate, and the results are expressed as the mean ±SD. The P value is written in the figure corner. Scale bar: 50 mm. *P < 0.05.

