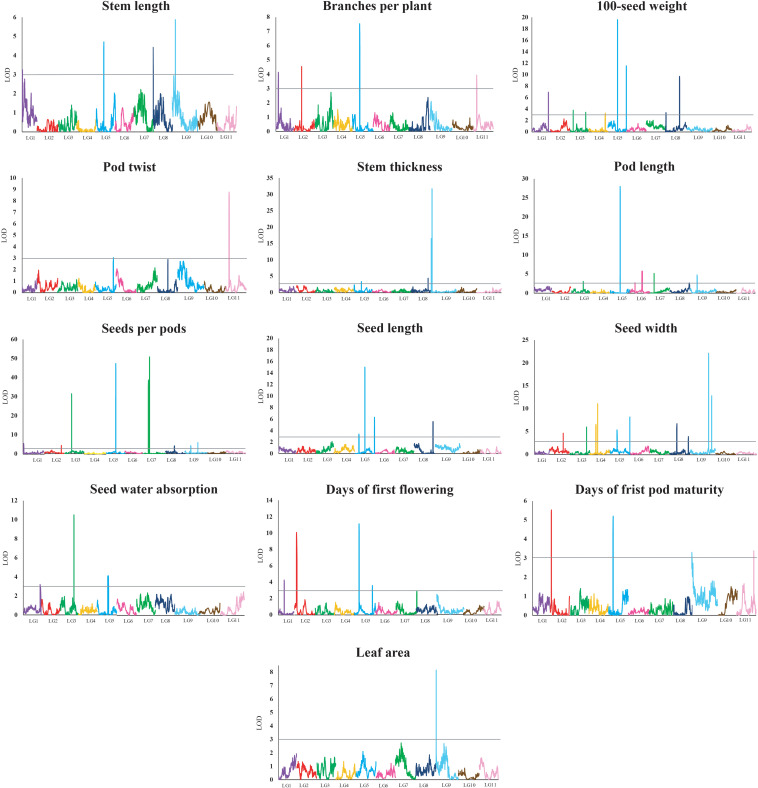
FIGURE 2.
Quantitative trait locus plots for 13 domestication-related traits in the zombi pea F2 population developed from a cross between cultivated zombi pea (TVNu 240; V. vexillata var. macrosperma) and wild zombi pea (TVNu 1623; V. vexillata var. vexillata). The x-axis indicates the linkage groups, whereas the y-axis indicates the logarithm of odds (LOD) scores. The gray line horizontal to the y-axis indicates the LOD significance threshold.

