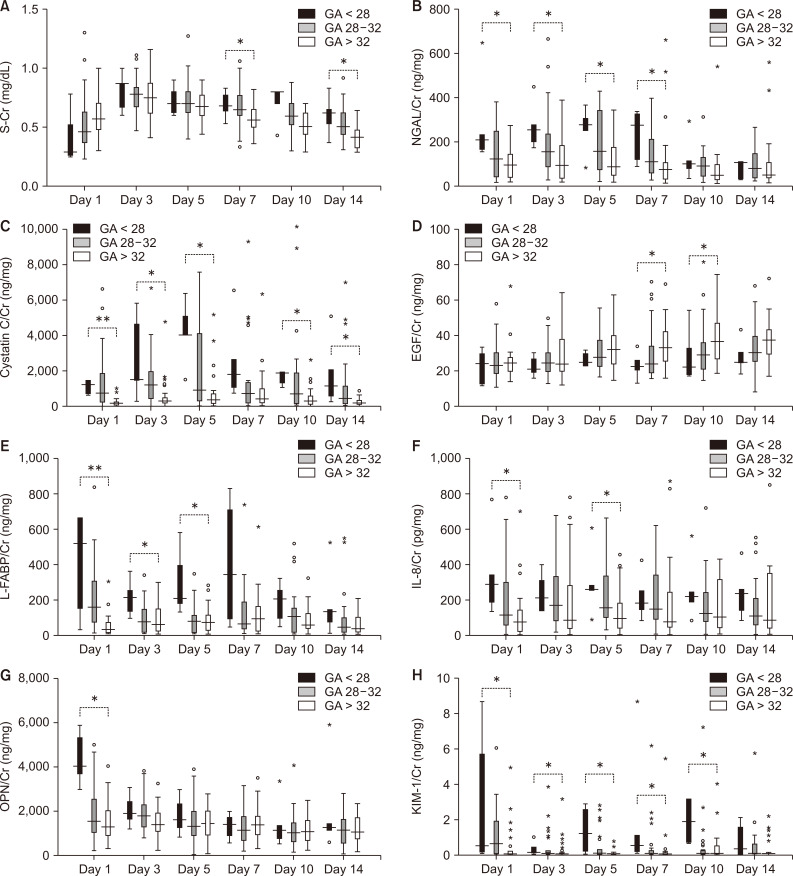
Figure 4. Differences in serum creatinine (S-Cr) and urine biomarkers levels according to gestational age (GA) in infants without acute kidney injury.
(A) Change of S-Cr. (B) Change of urine neutrophil-gelatinase-associated lipocalin (NGAL)/Cr ratio. (C) Change of urine cystatin C/Cr ratio. (D) Change of urine epidermal growth factor (EGF)/Cr ratio. (E) Change of urine liver fatty acid binding protein (L-FABP)/Cr ratio. (F) Change of urine interleukin-8 (IL-8)/Cr ratio. (G) Change of urine osteopontin (OPN)/Cr ratio. (H) Change of urine kidney injury molecule-1 (KIM-1)/Cr ratio. Values are shown in a box plot with 10, 25, 50, 75 and 90th percentiles and were analyzed by the Kruskal-Wallis test. *P < 0.05, **P < 0.001 between groups.

