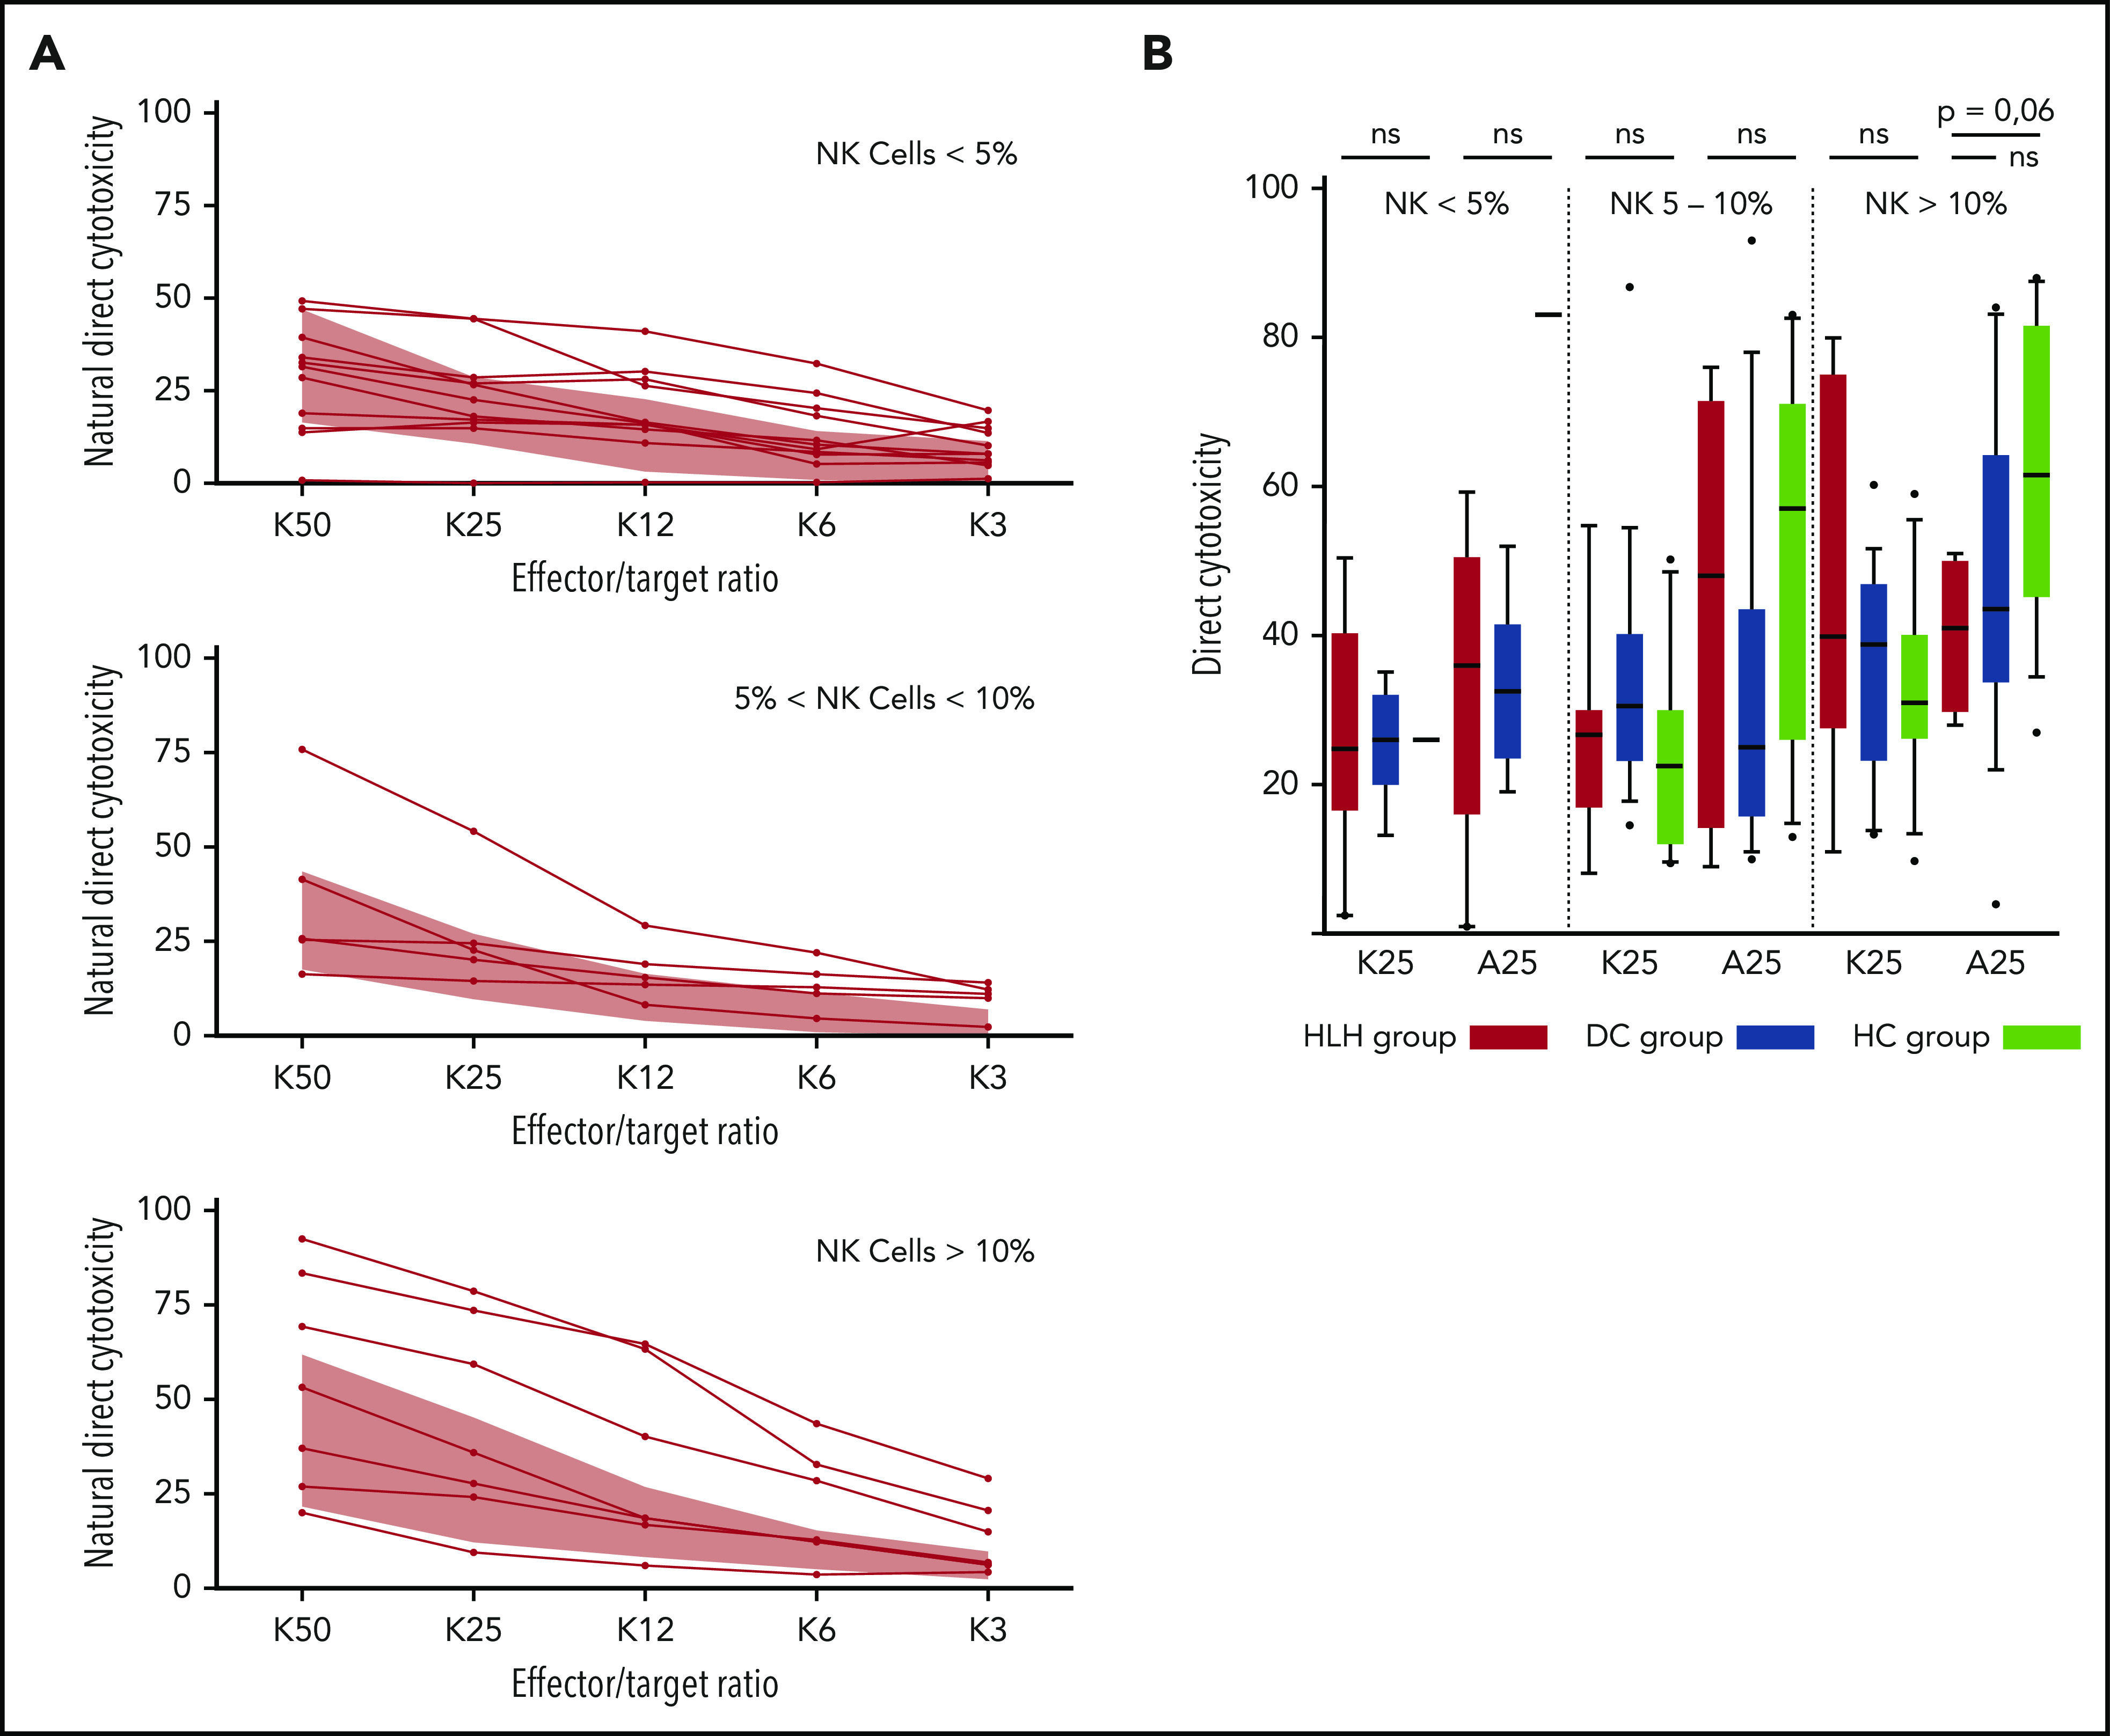
Figure 6.

Direct NK cell cytotoxicity depending on cell percentage (<5%, 5%-10%, >10%) of total lymphocytes. (A) Natural cytotoxicity is represented for the different E:T ratios. Each line represents 1 HLH patient. The gray waves represent normal values derived from HCs. (B) Evaluated in an E:T ratio of 25:1 (K25 for K562 targets and A25 for ADCC); no differences between the 3 groups. Each symbol represents an outlier (error bars, 10th and 90th percentiles). ns, not significant (P > .05) by Wilcoxon nonparametric test.
