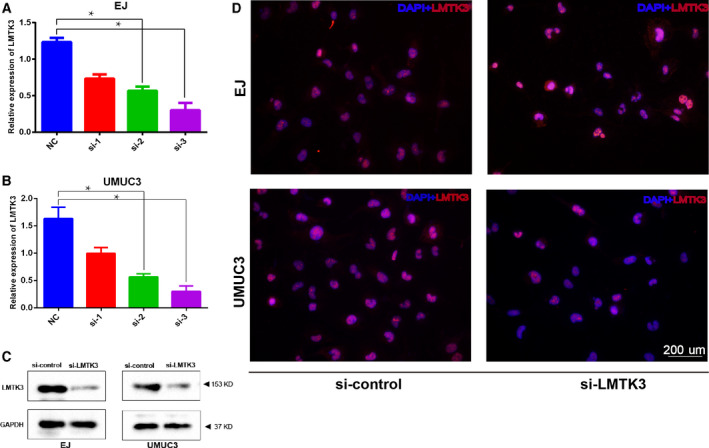
Fig. 4.

Knockdown LMTK3 gene with siRNA. (A, B) Real‐time quantitative PCR analysis of the knockdown efficiency of LMTK3 siRNA in EJ and UMUC3 cells. (C) Western blot assay revealed a significantly decreased protein abundance of LMTK3 by the si‐LMTK3 knockdown as compared with si‐control treatment. (D) Representative immunofluorescence staining of LMTK3 (red) in the si‐LMTK3 and si‐control groups. Data represent the mean ± SD of three separate experiments. Differences between two groups were compared using Student’s t‐test. *P < 0.01. Scale bar: 200 μm.
