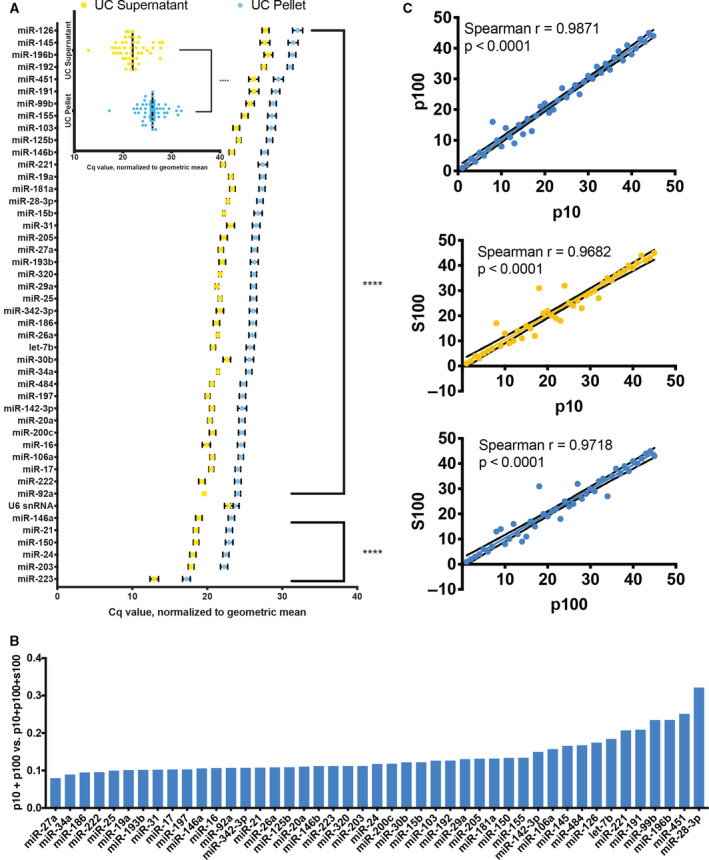
Fig. 2.

Relative abundance of miRNAs in different CVL fractions from all subjects (n = 6). (A) Abundant miRNAs in descending order based on C q values normalized to the geometric mean for each sample. Inset: average of all miRNAs in UC pellet and UC supernatant. Error bars: SEM. (B) miRNA expression in EV‐enriched fractions (p10, p100) as a percentage of total estimated expression (p10 + p100+S100 by C q) in ascending order, from miR‐27a‐3p (7.9%) to miR‐28‐3p (32.0%). (C) miRNAs in each fraction (10 000 g pellet = p10, 110 000 g pellet = p100, 110 000 g supernatant = S100, and) are significantly correlated (P < 0.0001, Spearman).
