
Fig. 8.
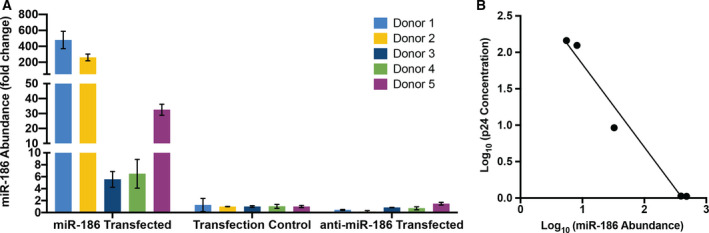
miR‐186‐5p abundance post‐transfection and correlation with p24 release. (A) Abundance of miR‐186‐5p in macrophages post‐transfection, as assessed by qPCR and compared (fold change) with the average of control macrophages (Mean ± SD). (B) Correlation of macrophage miR‐186‐5p and p24 concentration released in supernatant 3 days postinfection. P(two‐tailed) = 0.0019 (correlation), R 2 = 0.9731 (linear regression).