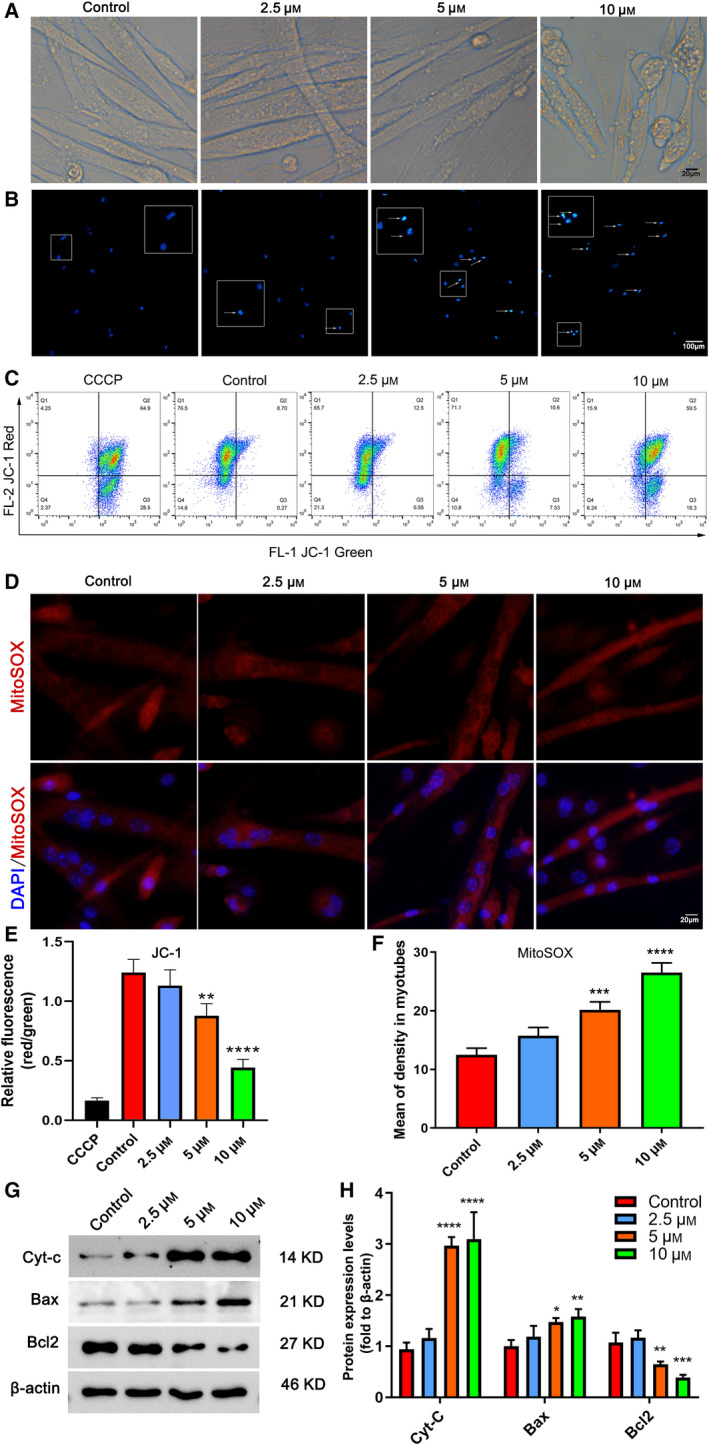
Fig. 1.

Apoptosis levels in myotubes with increasing concentration of NNC‐55 treatment for 24 h. C2C12 myoblasts were reseeded into six‐well plates and differentiated into myotubes for 4 days, followed by NNC‐55 treatment at various concentrations (0, 2.5, 5, and 10 µm; 0 µm was designated as the control group) for 24 h. Representative photographs of morphological changes of cell (A) and nuclei (typical of apoptosis, stained blue) stained with Hoechst 33258 (B). The apoptotic cells with strong fluorescence, fragmented, or condensed nuclei were observed under fluorescent microscopy, and selected fields illustrating occurrence of apoptosis were shown by white arrows. (C) JC‐1 flow cytometry analysis was performed, and the represented diagrams of flow cytometry were presented. (D) Representative imaging of mito‐ROS confocal images of each group and mean MitoSOX fluorescence intensities were presented. Quantitation of the JC‐1 red:JC‐1 green ratio in C2C12 myotubes treated by 5 and 10 μm NNC exhibited a decreased Δψm (E) and mean fluorescence density of MitoSOX in C2C12 myotubes (F). (G, H) Apoptosis‐related protein expression of C1C12 myotubes. Scale bars, 20 µm (A, D) and 100 µm (B); These data are presented as the (mean ± SD) for three independent experiments. *P < 0.05, **P < 0.01, ***P < 0.001, ****P < 0.0001 vs Control, respectively. One‐way ANOVA.
