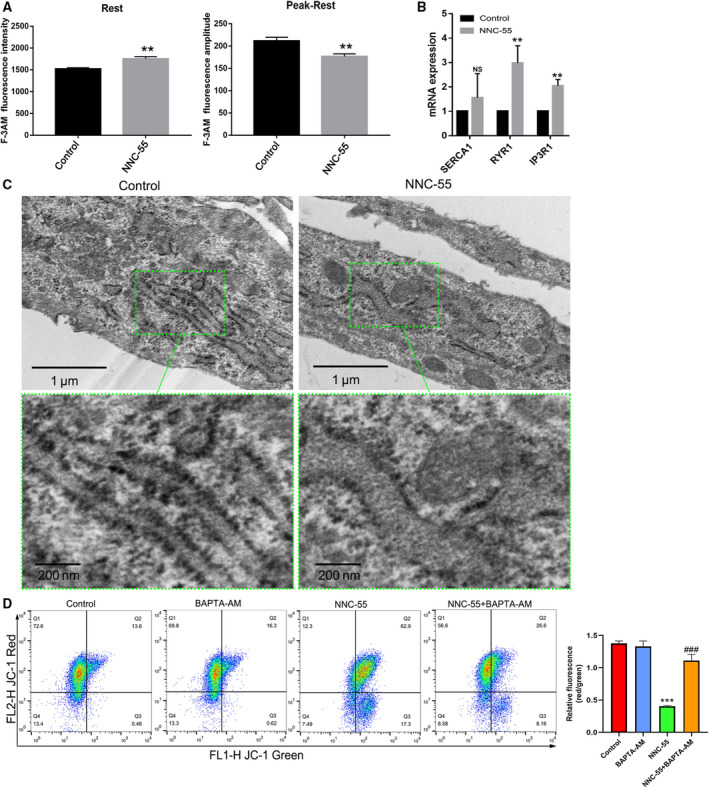
Fig. 2.

NNC‐55 treatment (10 μm, 24 h) induced ER‐Ca2+ release and ER‐Ca2+ dis‐homeostasis. (A) To estimate basal Ca2+ level, the average Ca2+ value for 1 min before stimulation was used. The increment of Ca2+ was calculated by subtraction of the basal level from each stimulus‐induced peak Ca2+ level (30 mm KCl). To quantify the effect of NNC‐55, basal Ca2+ level at rest and relative amplitude of Ca2+ induced by 30 mm KCl were calculated and the graphs presented the measurement of cytoplasmic Ca2+ concentration on a rest status and relative amplitude on a KCl‐induced peak‐rest status; (B) The gene expression related to important molecular components of the Ca2+ handling machinery of the ER (SERCA1, RYR1, IP3R1) by qRT‐PCR. (C) Morphological observations of subcellular structure in C2C12 myotubes treated by 10 µm NNC‐55 for 24h were obtained through transmission electron microscopy. Green frames indicate representative ultrastructural changes in top panels and were amplified in bottom panels. Scale bar, 1 µm (top panels) and 200µm (bottom panels). (D) MMP was assessed using JC‐1 staining by flow cytometry. JC‐1 fluorescence ratios (green/red) were calculated. JC‐1 staining showed that 10 µm NNC‐55 for 24 downregulated MMP with decreased JC‐1 red/green ratio in C2C12 myotubes compared to the control cells. These data are presented as the (mean ± SD) for three independent experiments. NS, no significance. **P < 0.01 vs Control; ***P < 0.001 vs Control; ### P < 0.01 vs NNC‐55, respectively; One‐way ANOVA and Dunnett's test were applied.
