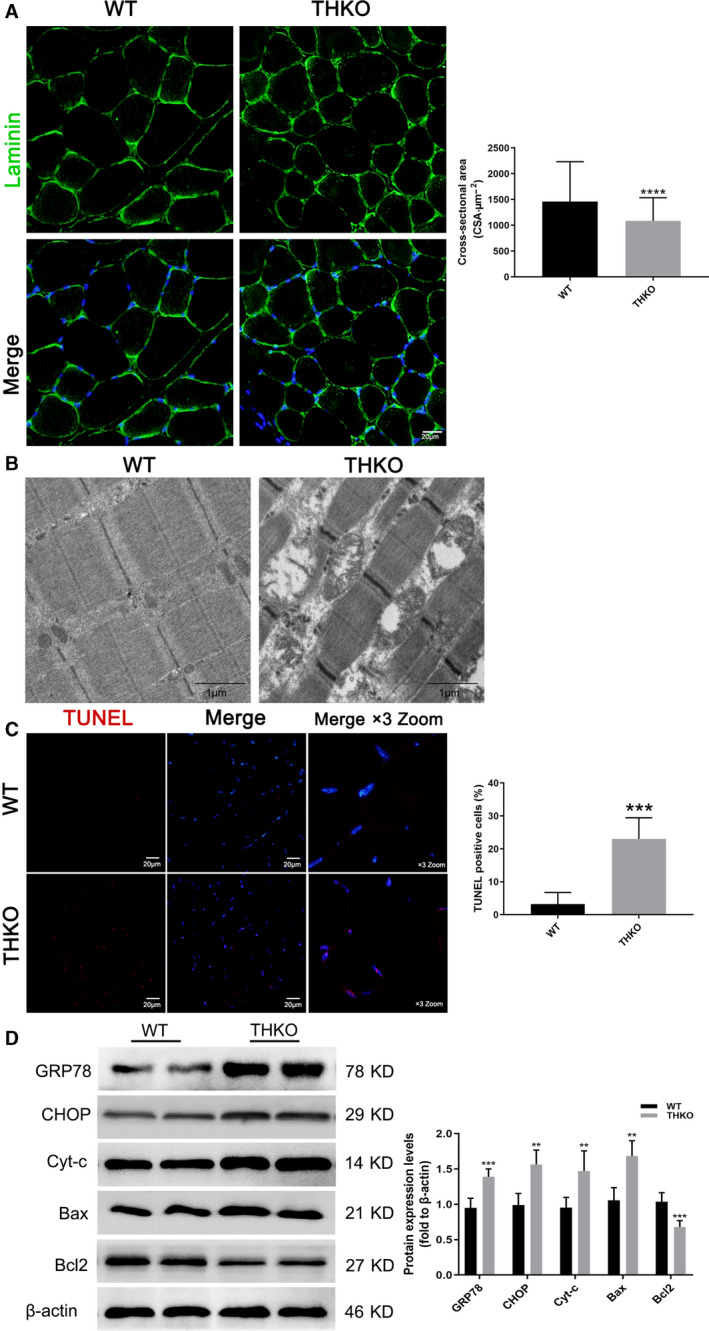
Fig. 6.

THKO mice displayed smaller muscle fiber size and ERS‐related apoptosis levels in TA. (A) CSA of TA muscle using laminin (green) and merged DAPI (blue) staining, and the quantification. Scale bar, 20 µm; (B) the ultrastructural morphology observation by a transmission electron microscope. Scale bars, 1 µm. (C) Cell apoptosis in TA muscle tissue by TUNEL assay. TUNEL‐positive cells were stained red, and cell nuclei were stained blue by DAPI. Scale bars, 20 µm; the merged images were amplified three times; (D) western blot results for GRP78, CHOP, Cyt‐c, Bax, and Bcl2 expression. These data are presented as the (mean ± SD) for three independent experiments. **P < 0.01, ***P < 0.001, ****P < 0.0001 vs Control by Student's t‐tests (unpaired two‐tailed).
