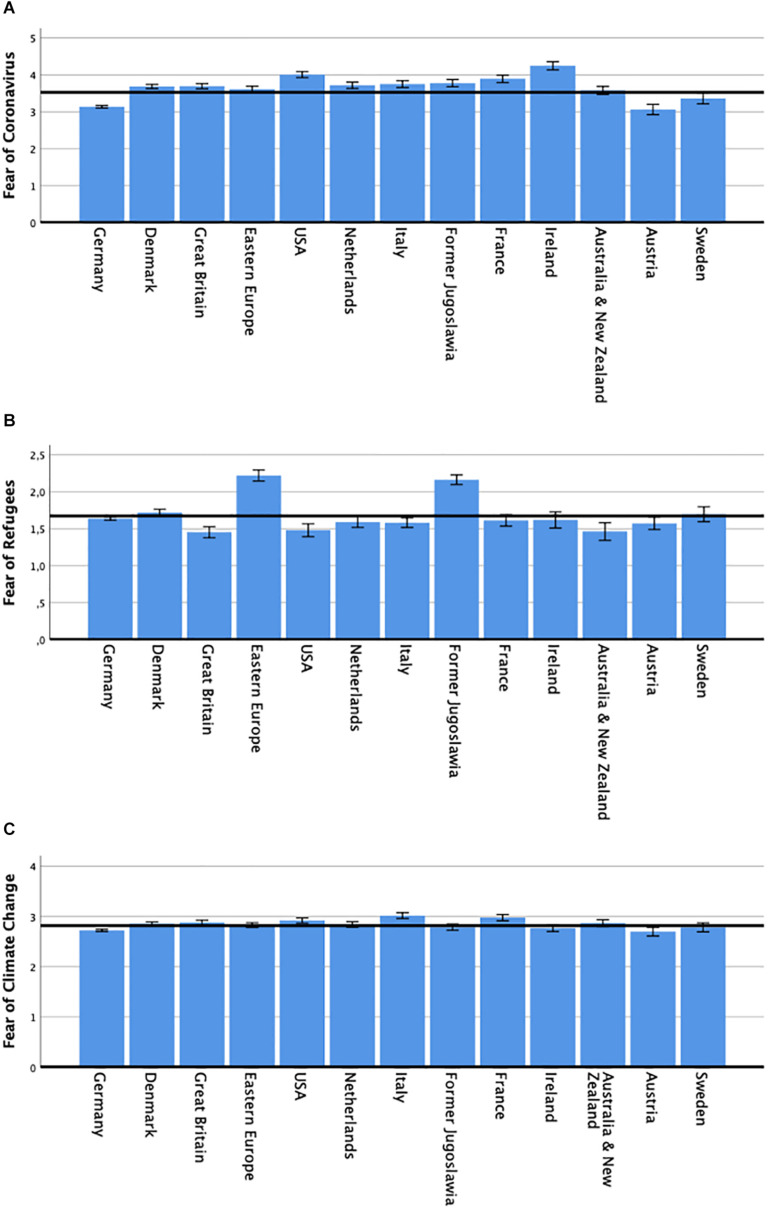
FIGURE 2.
Cross-cultural comparisons (A) Levels of fear of Coronavirus per country (n = 6531). (B) Fear of perceived threat of refugees per country (n = 4831). (C) Fear of climate change per country (n = 6531). The horizontal line in each graph marks the average score for the total sample. Depicted are means ±1 SEM.

