
Figure 2.
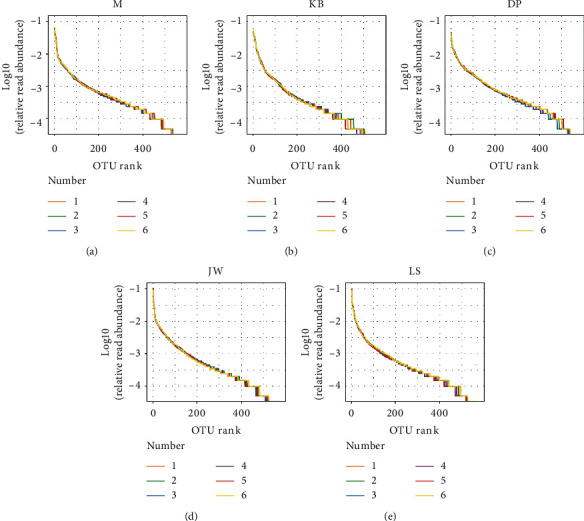
Rank-Abundance curves of intestinal flora in the mouse from each group.
Official websites use .gov
A
.gov website belongs to an official
government organization in the United States.
Secure .gov websites use HTTPS
A lock (
) or https:// means you've safely
connected to the .gov website. Share sensitive
information only on official, secure websites.
Rank-Abundance curves of intestinal flora in the mouse from each group.