
Figure 5.
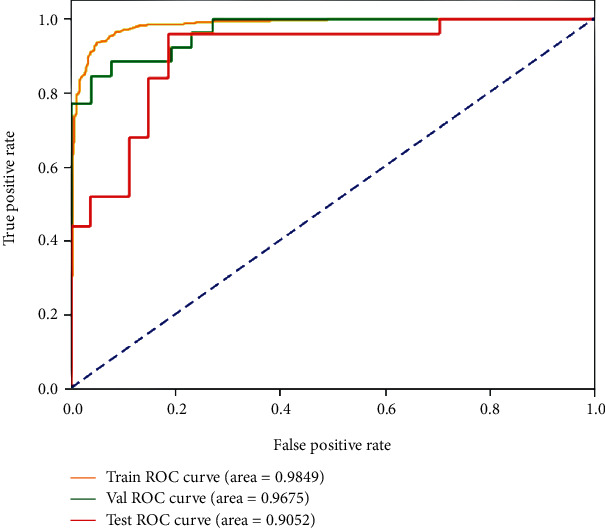
ROC curves of the best result on the FLAIR images for MGMT promoter methylation status classification on the training, validation, and testing datasets.
Official websites use .gov
A
.gov website belongs to an official
government organization in the United States.
Secure .gov websites use HTTPS
A lock (
) or https:// means you've safely
connected to the .gov website. Share sensitive
information only on official, secure websites.
ROC curves of the best result on the FLAIR images for MGMT promoter methylation status classification on the training, validation, and testing datasets.