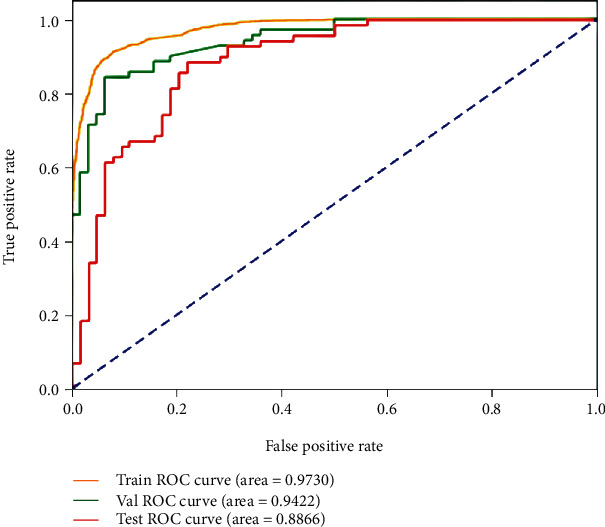
Figure 6.

ROC curves of the best result on the CE-T1W images for MGMT promoter methylation status classification in the training, validation, and testing datasets.

ROC curves of the best result on the CE-T1W images for MGMT promoter methylation status classification in the training, validation, and testing datasets.