
Figure 6.
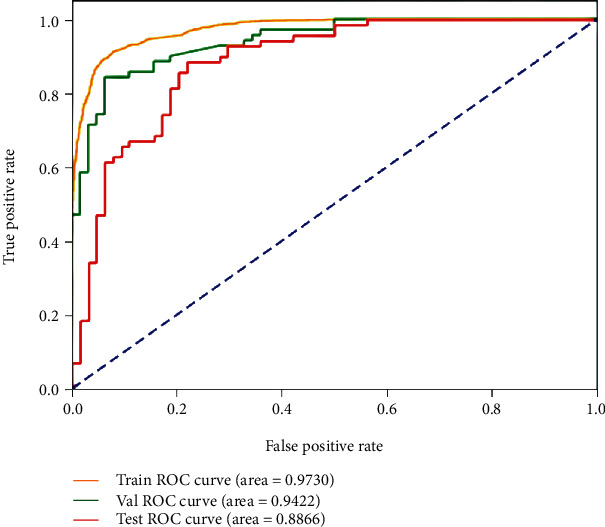
ROC curves of the best result on the CE-T1W images for MGMT promoter methylation status classification in the training, validation, and testing datasets.
Official websites use .gov
A
.gov website belongs to an official
government organization in the United States.
Secure .gov websites use HTTPS
A lock (
) or https:// means you've safely
connected to the .gov website. Share sensitive
information only on official, secure websites.
ROC curves of the best result on the CE-T1W images for MGMT promoter methylation status classification in the training, validation, and testing datasets.