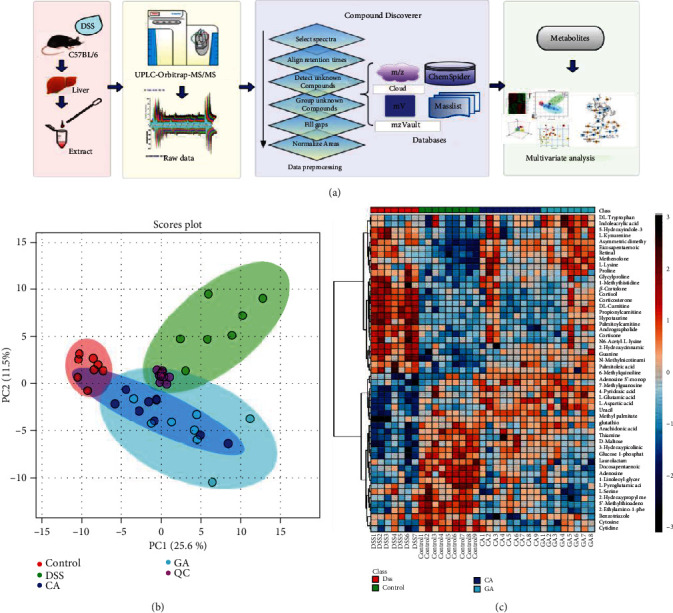
Figure 3.

Metabolomics analysis flowchart and multivariate statistical analysis. (a) The study process diagram includes sample preprocessing, instrumental analysis, data preprocessing and qualitative analysis, multivariate screening and differential metabolite screening. (b) PCA of the DSS group, control group, cecropin A group (CA), gentamicin group (GA), and QC. (c) Heatmap analysis of the metabolites (P < 0.05) based on one-way ANOVA.
