Figure 4.

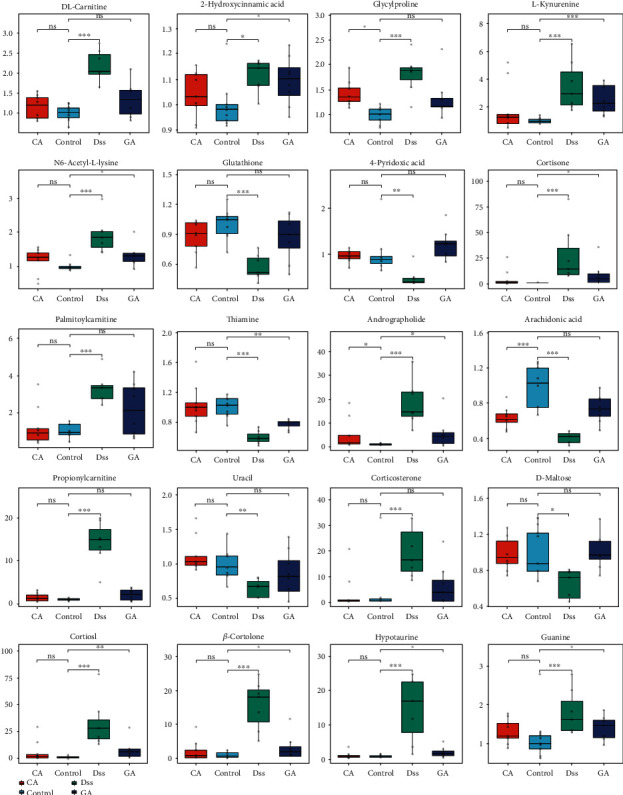
Box-plot of potential metabolites in the four groups: control, DSS, CA and GA group (∗P < 0.05, ∗∗P < 0.01, ∗∗∗P < 0.001, ns means not significant).

Box-plot of potential metabolites in the four groups: control, DSS, CA and GA group (∗P < 0.05, ∗∗P < 0.01, ∗∗∗P < 0.001, ns means not significant).