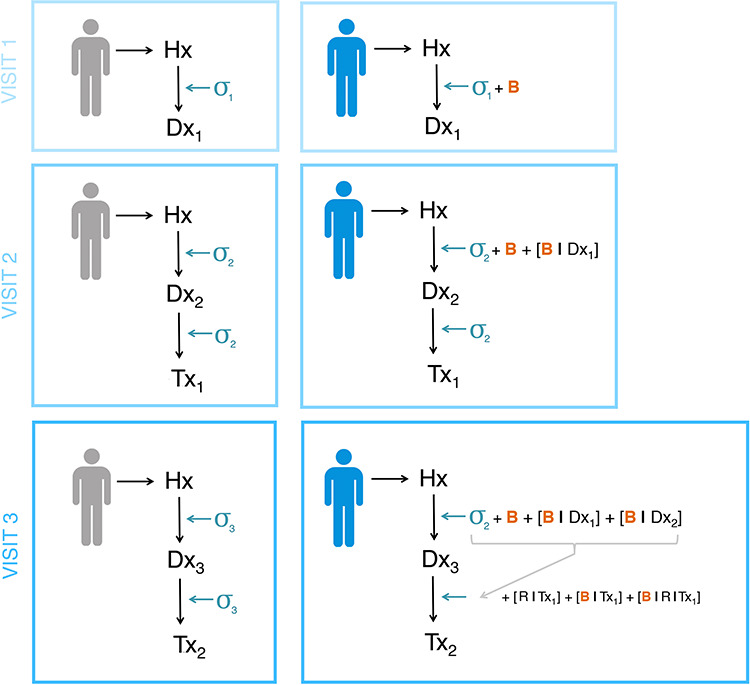
Figure 4.

Diagnostic journeys for two individuals through a healthcare system. Left: an ‘ideal’ non-biased diagnostic journey. Visit 1 produces a preliminary diagnosis (Dx1), with some uncertainty (σ1); a second visit refines this diagnosis (Dx2), resulting in reduced diagnostic uncertainty (σ2 < σ1) and treatment (Tx2). Visit 3 results in an increasingly appropriate diagnosis and treatment, and uncertainty continues to reduce (σ3 < < σ1). Right: modelling potential compound bias throughout a diagnostic journey. Here, an initial visit results in a diagnosis (Dx1) influenced by both uncertainty (σ1) and bias (B). Bias compounds across visits; Dx2 is influenced by both current physician bias (B) and bias relating to the previous diagnosis (B | Dx1). Similarly, treatments assigned at visit 3 will be influenced by compound bias based on knowledge of previous treatment options (B | Tx1) and response to those treatments (B | R | Tx1). Hx, hospital system; Dx, diagnosis; Tx, treatment; σ, uncertainty; B, bias; B | Dx, bias regarding previous diagnosis Dx; B | Tx, bias regarding previous treatment Tx; R | Tx, response to treatment Tx.
