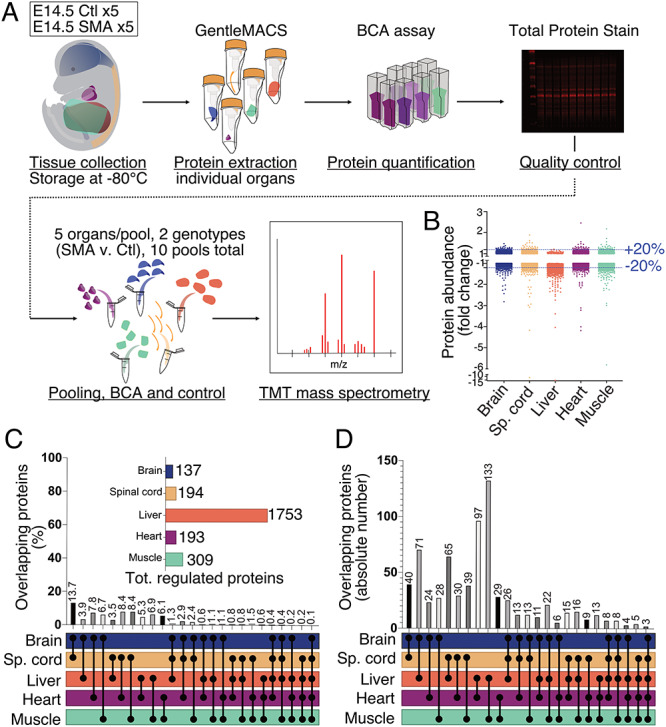
Figure 3.

TMT mass spectrometry revealed widespread, organ-specific changes in the proteome of SMA mouse embryos at E14.5. (A) Schematic representation of sample processing and experimental pipeline for the proteomics screen, Ctl stands for Control embryos. (B) Dotplot of all protein IDs mapped in IPA for each organ of interest. Dotted blue lines show the 20% up- and down-regulated threshold. (C) Bar chart showing the percentage of overlapping protein IDs dysregulated by 20% or more for every possible combination of organs. The horizontal bar chart shows the size of each set of dysregulated proteins used to identify overlaps. (D) Bar chart showing the absolute number of overlapping protein IDs dysregulated by 20% or more for every combination of organs possible.
