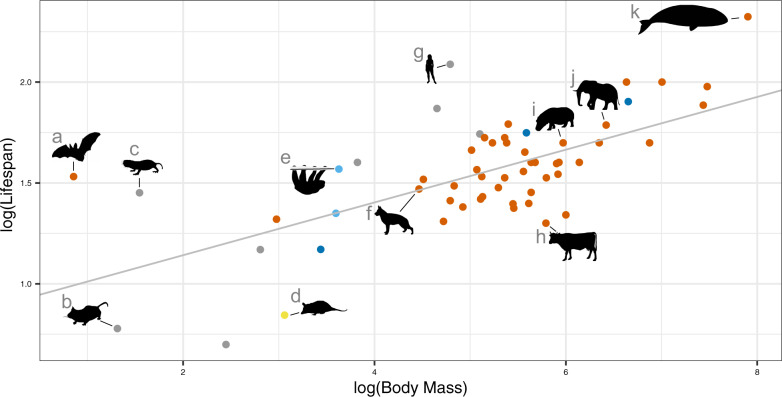
Fig. 3.
Relationship between body mass (g) and lifespan data (years) for 63 mammals. The gray line represents a linear regression between log10 body mass and log10 maximum lifespan (slope = 0.13, intercept = 0.88). Colors represent mammalian clades following figure 1A. Silhouettes from PhyloPic.org represent key lineages (animal figures not drawn to scale): (a) little brown bat (Myotis lucifugus), (b) house mouse (Mus musculus), (c) naked mole rat (Heterocephalus glaber), (d) gray opossum (Monodelphis domestica, by Sarah Werning https://creativecommons.org/licenses/by/3.0/), (e) two-toed sloth (Choleopus hoffmanni), (f) dog (Canis lupus familiaris), (g) human (Homo sapiens), (h) cow (Bos taurus), (i) hippopotamus (Hippopotamus amphibius), (j) African bush elephant (Loxodonta africana, by Jan A. Venter, Herbert H.T. Prins, David A. Balfour, and Rob Slotow, vectorized by T. Michael Keesey, https://creativecommons.org/licenses/by/3.0/), and (k) bowhead whale (Balaena mysticetus, by Chris Huh, https://creativecommons.org/licenses/by-sa/3.0/).

