Fig. 4.
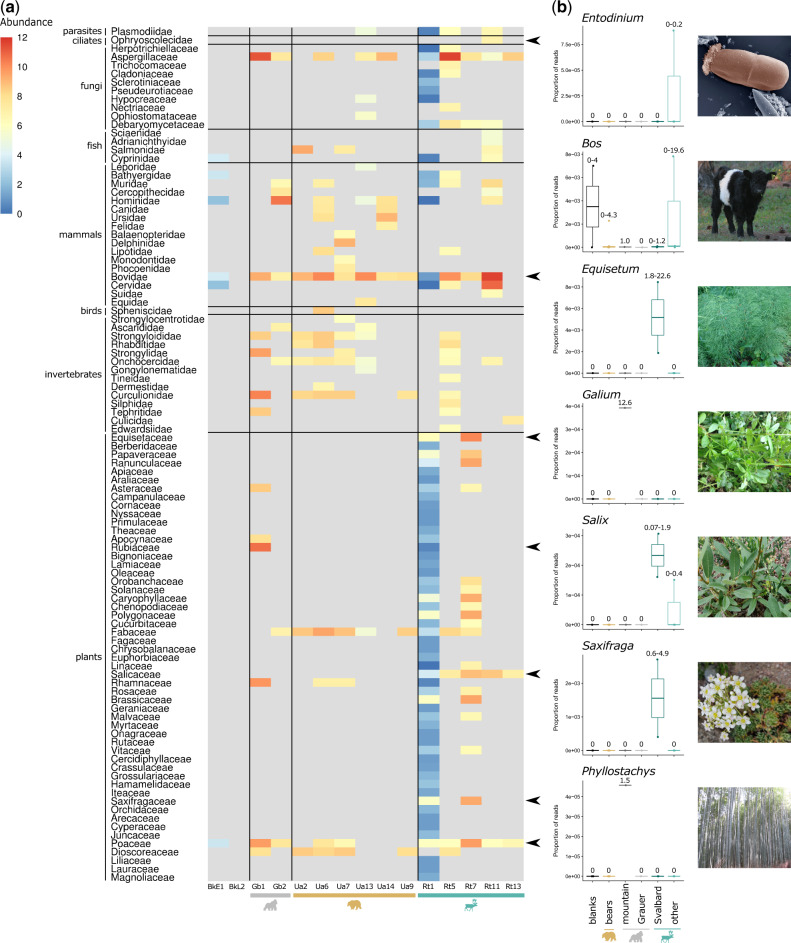
Host diet can be inferred from dental calculus. (a) MALT/MEGAN CLR normalized abundance of eukaryotic reads at the family taxonomic level. Taxa that were not detected in a sample are colored gray. Broad groups of eukaryotes are designated by horizontal black lines. Black arrows indicate selected families for which genus-specific relative abundances are plotted in (b). (b) Proportion of reads mapping to specific eukaryotic genera in different host species, including blank controls (visualized as Tukey boxplots). Gorilla samples are divided into the two subspecies (mountain and Grauer’s gorillas) and reindeer are divided into the high Arctic Svalbard ecotype and “other” ecotypes (mountain and forest) to illustrate population-specific differences in dietary components. The minimum and maximum number of reads mapping (in thousands) to each genus for the samples in each host category is shown above the boxplots. The Bovidae genus Bos is included as an example of spurious mappings, due to the presence of reads in samples from multiple host species and blank controls. Genera boxplots are ordered by family as indicated by the black arrows in (a). Image credit: Entodinium caudatum photo by Sharon Franklin and colorization by Stephen Ausmus, USDA Agricultural Research Service (www.ars.usda.gov/oc/images/photos/feb06/d383-2/, last accessed June 19, 2019) and other images by Katerina Guschanski and Jaelle Brealey.

