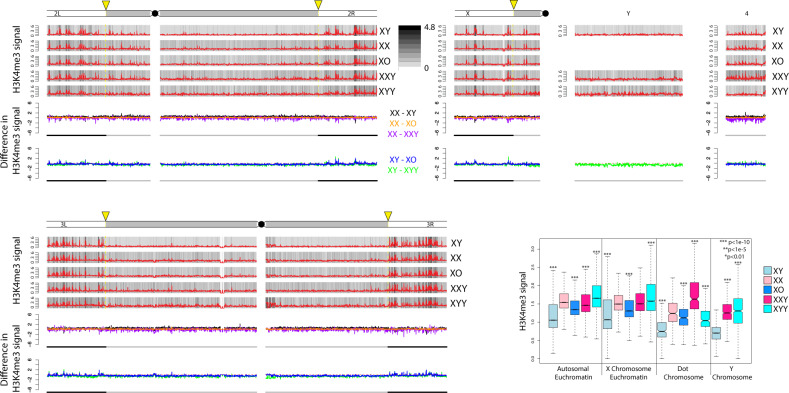
Fig. 2.
Enrichment of H3K4me3 for Drosophila melanogaster strains with different karyotypes across the euchromatin/heterochromatin boundary along each chromosome arm. We show the centromere-proximal 1-Mb euchromatic region of chromosomes 2, 3, and X, as well as the complete assembled heterochromatin region for each chromosome. For each karyotype, the enrichment in 5-kb windows is shown in red lines (normalized ratio of ChIP to input, see Materials and Methods), and the same data are shown in gray scale according to the scale in the upper right. Note that the enrichment profiles for all five karyotypes are plotted on the same scale to allow for direct comparisons. Below the enrichment profiles for each chromosome arm, subtraction plots show the absolute difference in signal of 5-kb windows between pairs of karyotypes along the chromosome arms. The cytogenomically defined heterochromatin is marked by gray bars and the euchromatin/heterochromatin boundary is indicated by a yellow arrow. The box plots show the ChIP signal for all 5-kb windows in different chromosomal regions, with boxes extending from the first to the third quartile and whiskers to the most extreme data point within 1.5 times the interquantile range. P values were calculated relative to XX females for XY males and XXY females and relative to XY males for X0 and XYY males; P values for the Y chromosome were calculated relative to XY males (Wilcoxon test). For genome-wide enrichment plots, see supplementary figure S13, Supplementary Material online.

