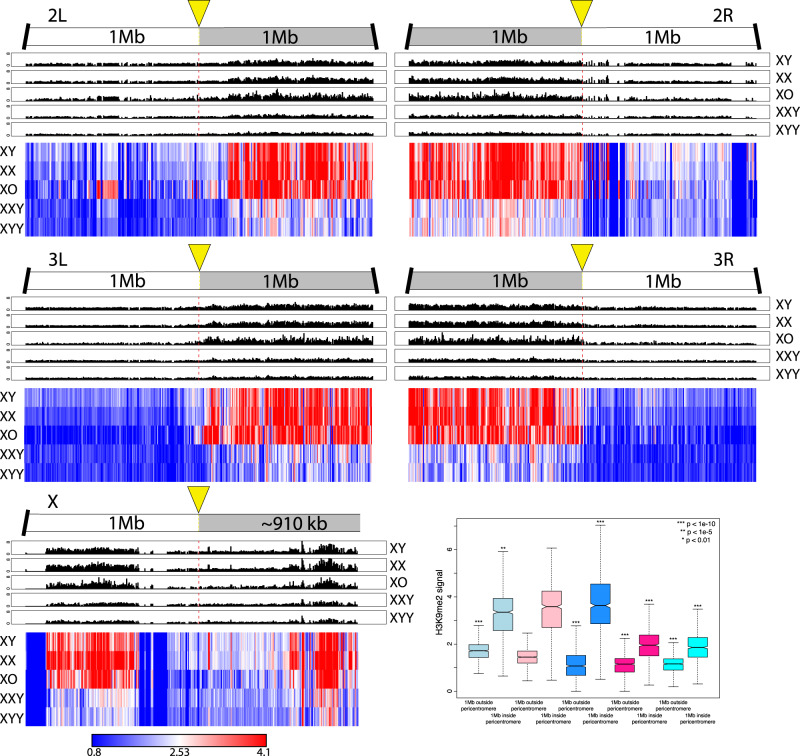
Fig. 5.
Enrichment of H3K9me2 within 1 Mb of the heterochromatin/euchromatin boundaries (as defined in the Release 6 of the Drosophila melanogaster genome [Hoskins et al. 2015]). The upper panels show H3K9me2 signal in 5-kb windows for each chromosome arm, and the bottom panel shows scaled heatmaps for the same 5-kb windows, to allow direct comparisons of H3K9me2 signal across samples. For H3K9me3 plots, see supplementary figure S16, Supplementary Material online. Box plots show H3K9me2 signal of 5-kb windows in euchromatic regions 1 Mb outside the pericentromere versus 1 Mb inside the heterochromatin/euchromatin boundary. Significance values are all calculated using the Wilcoxon test.

