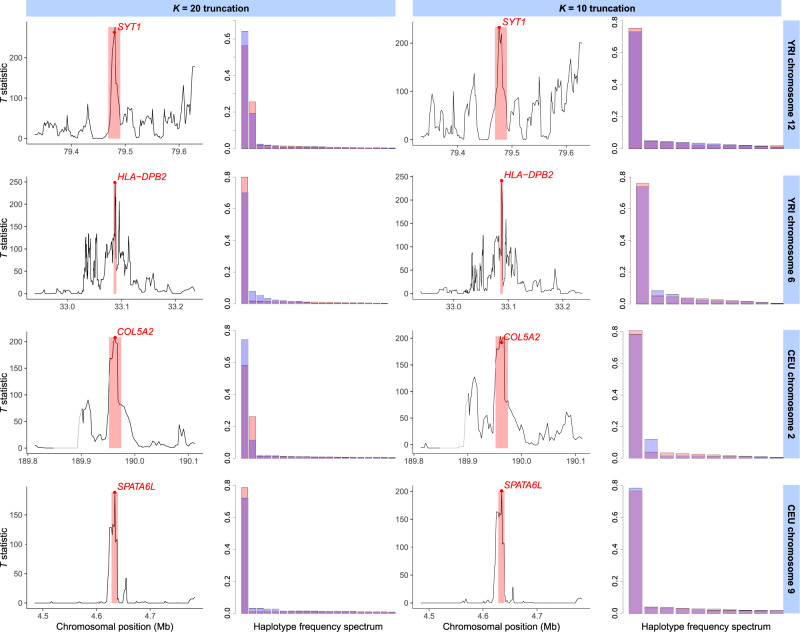
Fig. 5.
Selective sweep candidates detected with the T statistic from the 1000 Genomes Project data set (1000 Genomes Project Consortium et al. 2015) as for scans with a K = 20 (left) and K = 10 (right) truncation. For each of four sweep candidates in the human YRI (top two rows) and CEU (bottom two rows) populations, we show the T statistic across the 300-kb interval surrounding the candidate peak, as well as the frequency spectra for the most likely sweep model corresponding to the candidate at the 117-SNP analysis window of maximum T. The window of maximum T is shaded in red, with the position of the window center (median SNP) as a red dot. The frequency spectrum of the most likely model is also shown in red, whereas the observed frequency spectrum at the point of maximum T is overlaid in blue. The displayed candidates are a putative soft sweep () at SYT1 in YRI (top row), hard sweep () at HLA-DPB2 in YRI (second row), soft sweep ( when analyzed with K = 20; hard for K = 10) at COL5A2 in CEU (third row), and hard sweep at SPATA6L in CEU (bottom row). We note that the window of maximum signal for K = 10 and K = 20 differed for SYT1 (top row). The gray segment upstream of COL5A2 (third row) indicates a portion of the genome that was filtered out (see Materials and Methods).

