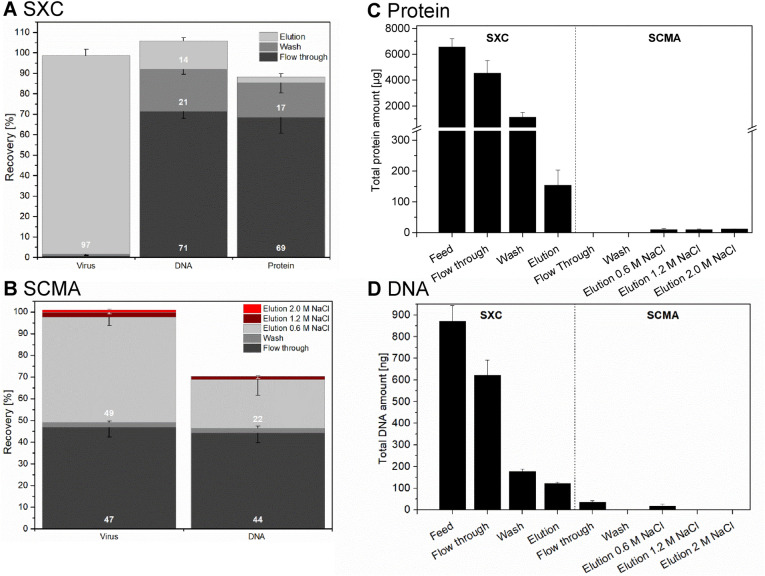
Figure 6.
Process performance for a different HCV genotype. Shown is (A) the recovery of virus, DNA and protein during SXC and (B) the recovery of virus and DNA in the different SCMA fractions. Furthermore, (C) the total protein amounts and (D) the total DNA amounts throughout the process are depicted. All recovery values are step-recoveries, correlated to the quantities in the loading sample of the respective step. For the SCMA, no protein and DNA recoveries and amounts are depicted in case the concentration was below the limit of detection of the assay (0.5 µg/mL and 25 pg/mL for protein and DNA, respectively). Error bars indicate technical triplicates with error bars reflecting SD.

