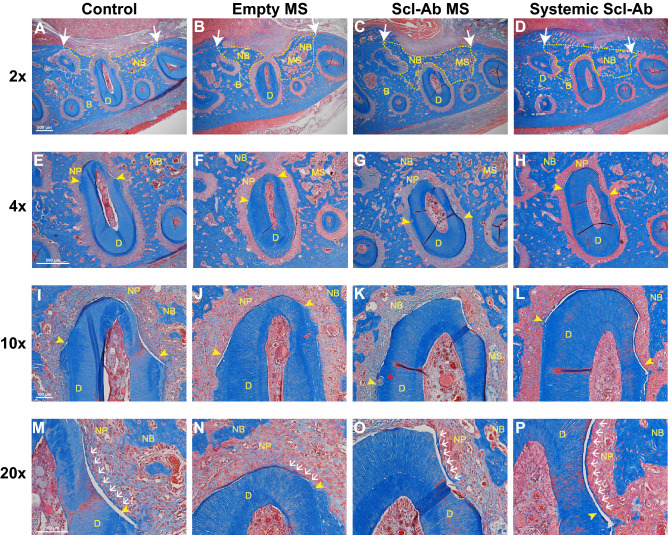
Figure 4.
Histological analysis of periodontal healing at 21 days after surgery. The sections were stained with Masson’s Trichrome. The ×2 images of alveolar bone defect and newly formed bone areas are shown (A–D). White arrow indicates the edges of the original bone defect and newly bone areas are outlined with dashed yellow line. 4 × images of the distal root of the first molar (E–H). Yellow arrowheads demarcate the edges of exposed tooth dentin surface. 10 × images of newly formed periodontal tissue at the distal root of the first molar (I–L). 20 × images for newly formed cementum-like tissues (M-P). Scale bars indicate 500 μm (A–H) and 100 μm (I–P). D, dentin; B, bone; NB, new bone; MS, microspheres; NP, newly regenerated periodontal ligament. Yellow arrowheads, the edge of exposed tooth dentin; white arrows, new cementum; red arrows, root resorption; Sample sizes were 12 in Control, 12 in empty MS, 12 in Scl-Ab MS and 9 in the systemic Scl-Ab group.

