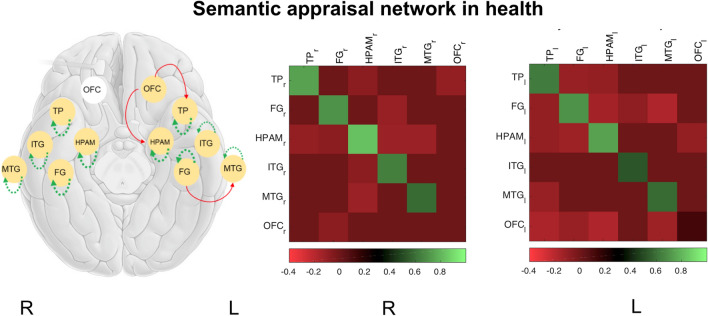
Figure 1.
Effective connectivity of the healthy semantic appraisal network. The left panel shows a model of the network, comprising six nodes in the right (R) and left (L) cerebral hemispheres (here rendered on a cartoon view of the brain from below): FG fusiform gyrus, HPAM hippocampus–amygdala complex, ITG inferior temporal gyrus, l left, MTG middle temporal gyrus, OFC orbitofrontal cortex, r right, TP temporal pole. Gold circles indicate regions whose extrinsic connections survived Bayesian model reduction. Dashed lines indicate recurrent (intrinsic) connections within regions and solid lines indicate (extrinsic) connections between regions. Line colours code the parity of connectivity: red, inhibitory; green, excitatory (see also Table S2). The middle and right panels show the corresponding connectivity matrices for each cerebral hemisphere, the colour scale here coding connection strength (in Hz). Note: connections on the main diagonal (or self-coupling) are always inhibitory but values are log-scaled such that positive values (green; recurrent connections) indicate greater inhibition and negative values (red) less inhibition.

