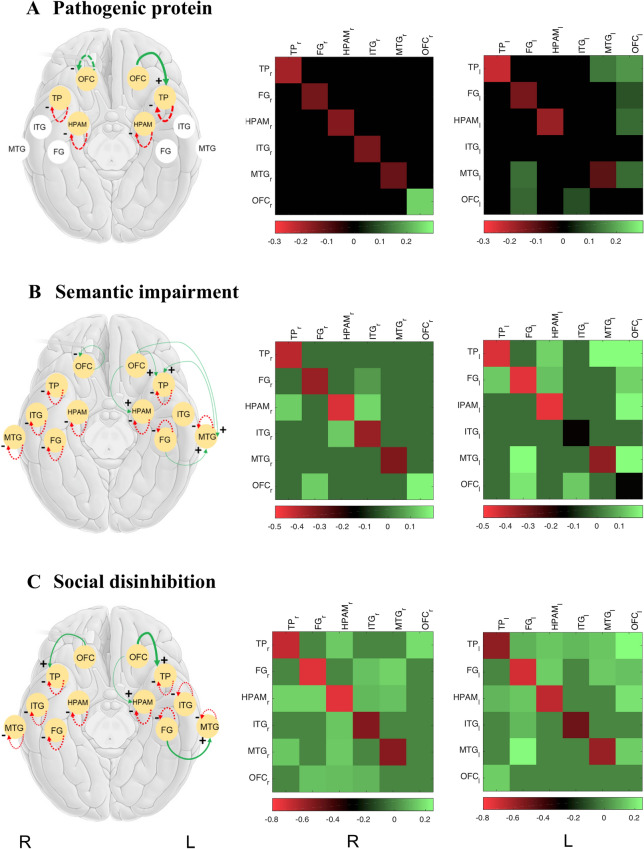
Figure 2.
Effects of major disease factors associated with semantic dementia on effective connectivity of the semantic appraisal network. The left panels show brain cartoons representing connection changes in the right (R) and left (L) cerebral hemispheres associated with pathogenic protein deposition (A), semantic impairment (B) and disinhibited behaviour (C), comparing the semantic dementia group with the healthy control group (semantic dementia > controls). Gold circles code regions that show significant connectivity effects that survived Bayesian model reduction. Dashed lines indicate recurrent (intrinsic) connections within regions and solid lines indicate (extrinsic) connections between regions. Line colours code direction of connectivity changes relative to the group mean: red, decreased; green, increased. Line thickness codes the effect size; connection parity (derived by summing directional connectivity change with mean baseline connection strength) is coded as +, excitatory or −, inhibitory (see also Table S2). The middle and right panels show the corresponding matrices of connectivity changes for each cerebral hemisphere, the colour scale coding (log-scaled) connection strength (in Hz). Positive connectivity values (green) represent a positive change in effective connectivity with increasing score for a given disease factor while negative values (red) represent a negative change in effective connectivity with increasing score. Connectivity matrices after adjusting for regional grey matter atrophy are shown in Supplementary Figure 3 and for inter-hemispheric connections are shown in Supplementary Figure 4. FG fusiform gyrus, HPAM hippocampus–amygdala complex, ITG inferior temporal gyrus, l left cerebral hemisphere, MTG middle temporal gyrus, OFC orbitofrontal cortex, r right cerebral hemisphere, TP temporal pole.

