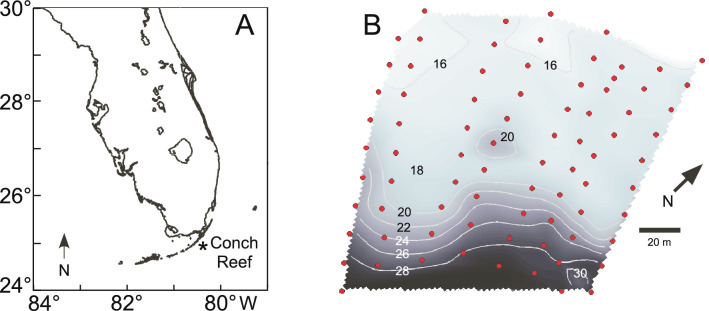
Figure 1.
Site Location. (A) Map of the study site at Conch Reef (24°57.0′ N, 80°27.3′ W) Florida, U.S.A. Map created using MATLAB (R2018a)102. (B) Detailed bathymetry, and Benthic Oceanographic Array (BOA) sensor node locations at the study site. Sensor locations sampling sites are indicated by the red dots. The depths of selected contour intervals are indicated by the numerals in 2 m increments and shown as the grey lines over the grey scale background (deeper = darker).

