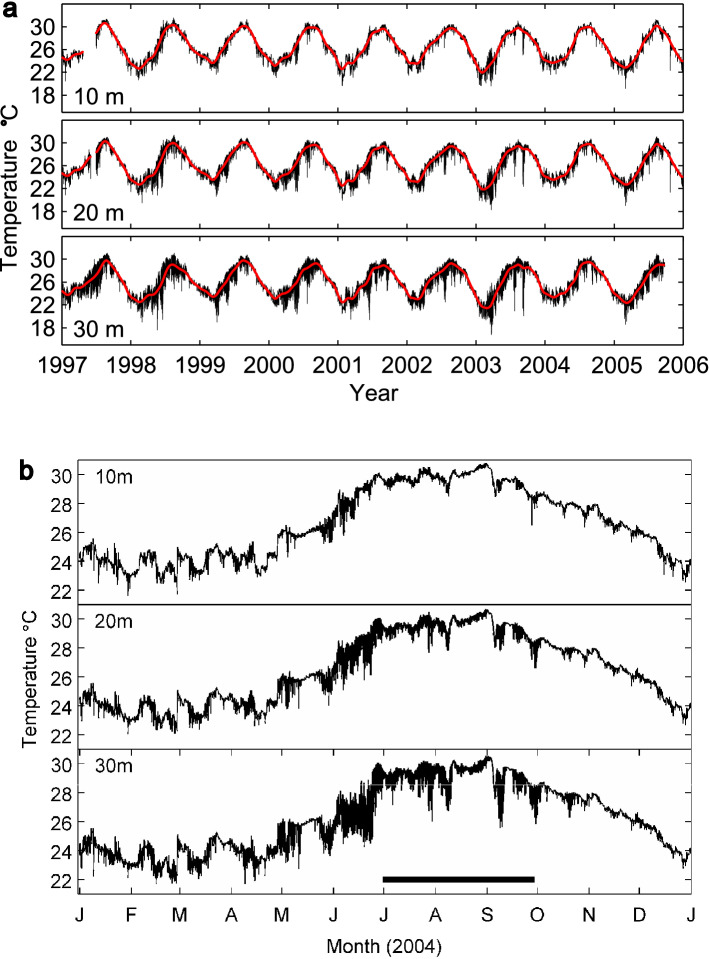
Figure 2.
Temperature variation on Conch Reef. Variation in water temperature at Conch Reef recorded at the 10, 20 and 30 m isobaths. Data were sampled at 2 min intervals and averaged in 10 min bins for plotting the complete data set. (A) Data collected from 1997 through 2006. Red line indicates the average temperature. (B) Expanded view of water temperature during 2004 show high temperature variability. The period of high-resolution data collection from the Benthic Oceanographic Array, during July through September is indicated by the black horizontal bar.

