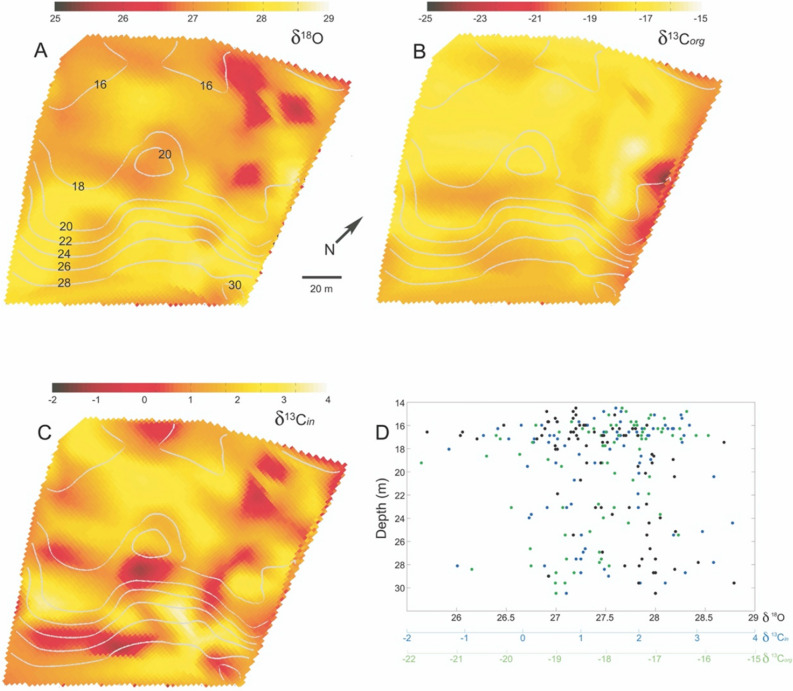
Figure 4.
Halimeda tuna δ18O and δ13C. Isotopic analysis from Halimeda tuna samples collected at the Benthic Oceanographic Array node locations (see Fig. 1) and interpolated onto the reef bathymetry. Depth contours, scale and orientation are the same for all subfigures. (A,B) The inorganic δ13Cin and organic δ13Corg carbon component relative to Vienna Peedee belemnite. (C) δ18O relative to SMOW. (D) Benthic sample depth vs isotopic component values from A–C. The δ13Cin, δ13Corg and δ18O components are shown by the black, blue and green markers respectively.

