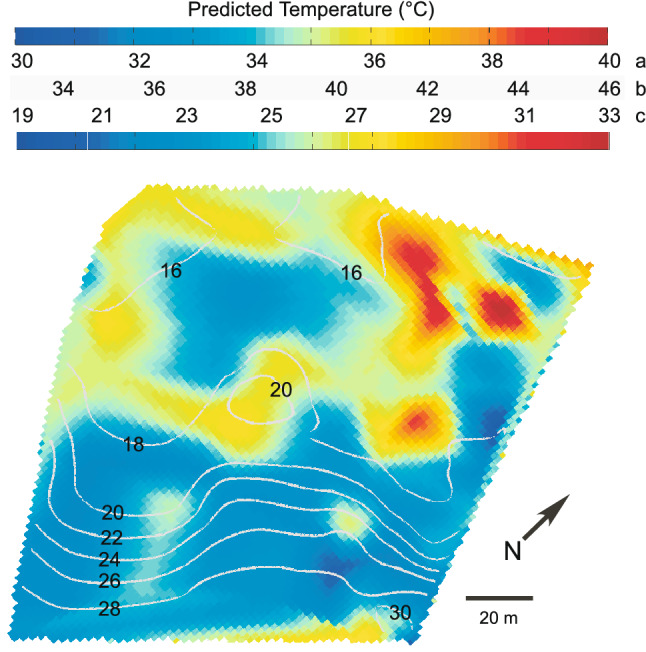
Figure 5.

Predicted paleotemperature mapped onto reef bathymetry. Predicted temperatures using isotopic thermometer models, which are variations of the Epstein paleotemperature equation24,25 interpolated over the reef bathymetry using the sampled δ18O data. The numerals on the grey contour lines on the map indicate depth in m. Because the models are linear, the colour bar gradient and range is identical for all model results, however the absolute scaling varies. The two temperature colour bars above the map are identical. The predicted temperature scales are calculated from: (A) late Holocene Halimeda from the northwest Caribbean34 using Grossman and Ku64; (B) Miocene Halimeda reef material21 modified from Böhm et al.67; (C) Porities sp. aragonite collected from the Galapagos81.
