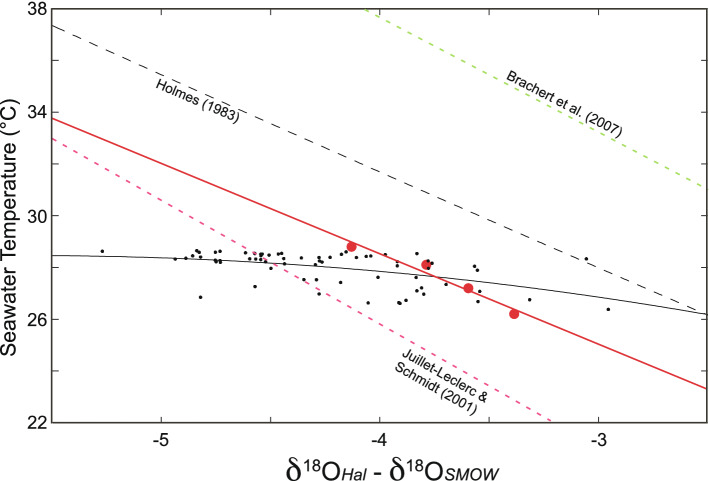
Figure 6.
Seawater temperature predictions. Predicted seawater temperature (°C) vs Halimeda δ18O using mean benthic temperature data from Conch Reef collected during the summer 2004 Benthic Oceanographic Array deployment (black dots, see Fig. 3) and using the mean temperature data collected from 1997–2006 (red dots, see Fig. 2) and binned into 5 m depth intervals from 10 to 35 m (see also55). The black line indicates seawater temperature predicted by the best fit equation T (in °C) = 21.0−2.6 (δ18OHalimeda—δ18Oseawater) − 0.24 (δ18OHalimeda − δ18Osseawater)2 for the BOA data (r2 = 0.26). The red line indicates seawater temperature predicted by the best fit equation T (in °C) = 14.2–3.6 (δ18OHalimeda − δ18Oseawater) for the binned mean temperature data from 1997–2006 (r2 = 0.92). Seawater temperatures predicted by Holmes34, Brachert et al.21 and Juillet-Leclerc and Schmidt66 (see also Fig. 5 above) are shown by the dashed black, green and magenta lines respectively.

